
Pig Farming Economics and Profitability:Guide for U.S. Producers in 2026
Leave a Comment / Commercial Pig Farming in the USA
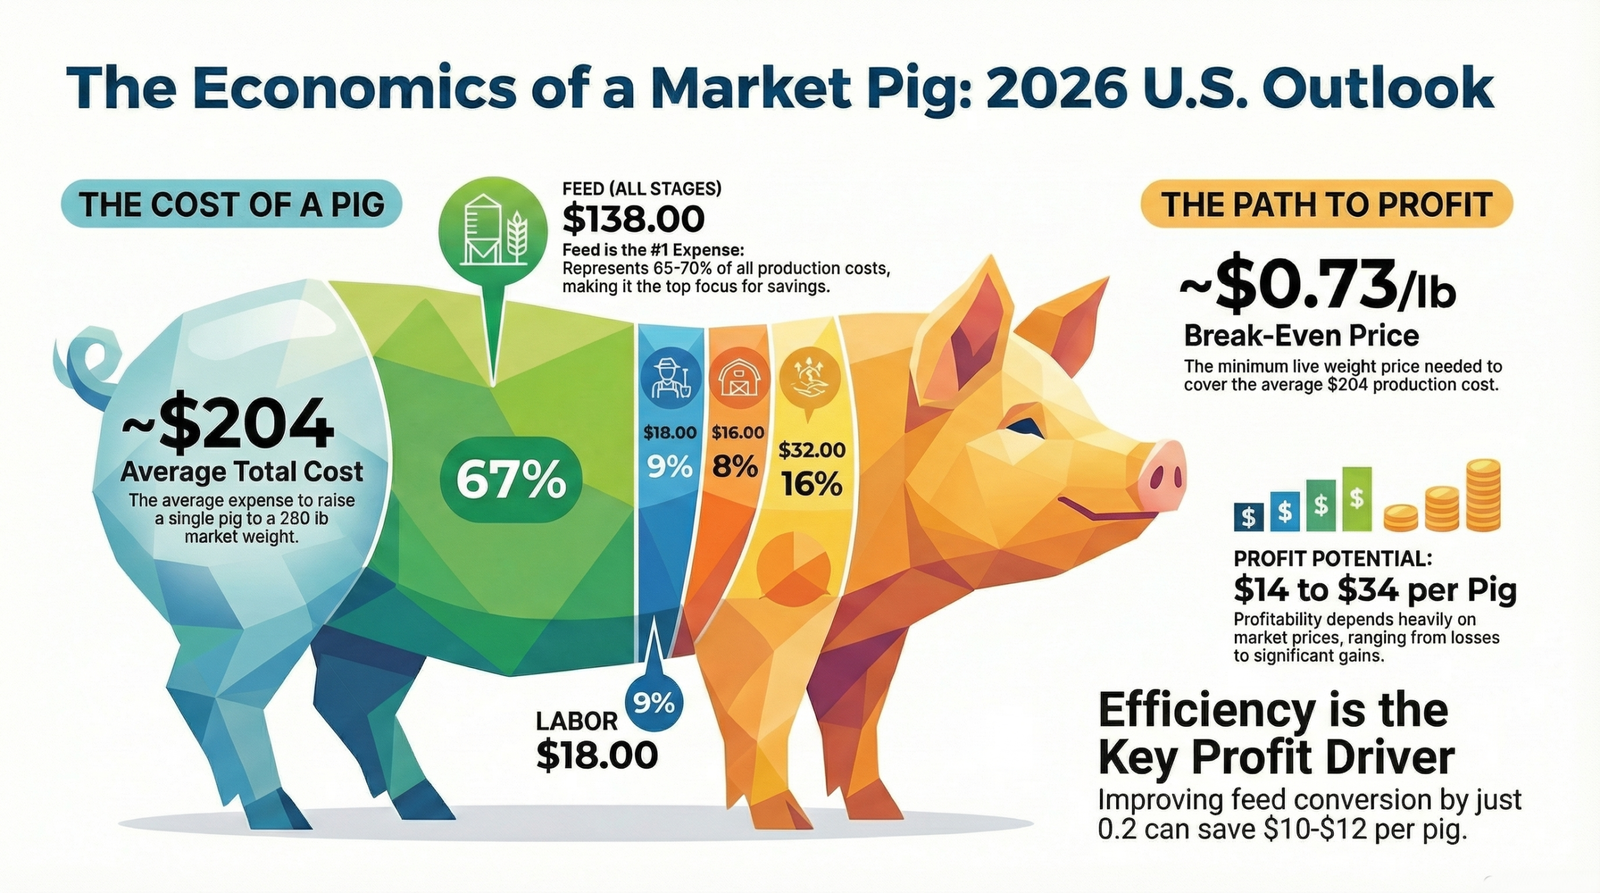
Financial Reality: Pig farming economics determines which operations thrive and which struggle to survive. Feed costs alone represent 65 to 70 percent of total production expenses, making feed efficiency the primary driver of profitability. Understanding pig farming economics—including cost structures, revenue optimization, and risk management—separates profitable operations earning $15 to $30 per head from those losing money on every pig marketed. This guide provides the financial framework for informed decision-making in 2026 U.S. pork production.
Introduction: Why Pig Farming Economics Matters
Pig farming economics forms the foundation upon which all production decisions ultimately rest. While animal husbandry skills, genetic selection, and health management determine biological potential, financial management determines whether that potential translates into sustainable profitability or chronic losses.
The U.S. pork industry operates on thin margins where small improvements in efficiency or small cost reductions compound into significant profit differences. Top-performing operations consistently achieve profits of $20 to $35 per marketed pig, while bottom-quartile operations often lose $5 to $15 per head on the same market conditions. This performance gap reflects management quality, not luck or market timing.
Understanding pig farming economics enables informed decisions across all operational areas. Feed purchasing strategies, genetic selection, facility investment, labor allocation, and marketing timing all carry financial implications that ripple through the operation. Decisions made without financial context may optimize one parameter while degrading overall profitability.
Financial planning also shapes strategic direction. Herd expansion, facility modernization, and genetic investment all require capital allocation decisions informed by expected returns. Operations without clear financial frameworks often either under-invest (limiting competitiveness) or over-invest (creating debt burdens that threaten survival during market downturns).
The 2026 economic environment presents both opportunities and challenges for pig farming economics. Feed prices have moderated from 2022 peaks but remain elevated compared to historical averages. Labor costs continue rising, accelerating automation investment. Market access increasingly requires welfare and sustainability documentation, adding compliance costs while potentially enabling premium pricing.
Cost Structure in Pig Farming Economics
Understanding cost structure enables targeted improvement efforts and informed break-even analysis. Pig farming economics fundamentally reflects the relationship between input costs and output value, with feed dominating the cost structure across all production systems.
Production Cost Breakdown
Feed Costs (65–70%): Feed represents the largest cost category by far, consuming roughly two-thirds of total production expenses. A market pig consuming 650 to 750 pounds of feed at $0.18 to $0.22 per pound incurs $120 to $165 in feed costs alone. Feed efficiency improvements directly impact the largest cost category, making them the highest-leverage optimization opportunity in pig farming economics.
Labor Costs (8–12%): Labor requirements vary dramatically by operation scale and automation level. Large commercial operations may spend $3 to $6 per marketed pig on labor, while small operations with limited automation may exceed $15 to $20 per pig. Rising wages continue pressuring labor costs upward, driving automation investment.
Housing and Facilities (6–10%): Facility costs include depreciation, maintenance, and repairs. New facility construction at $200 to $400 per pig space translates to $8 to $16 annual depreciation over 25-year useful life. Older facilities with lower depreciation but higher maintenance costs may have similar total facility expenses.
Health and Veterinary (3–5%): Vaccination, medication, and veterinary services typically cost $4 to $8 per marketed pig in well-managed herds. Disease outbreaks can dramatically increase these costs while simultaneously reducing revenue through mortality and performance losses.
Breeding Stock (2–4%): Semen, gilt replacement, and boar costs allocated across offspring. Operations using premium genetics may spend $4 to $6 per marketed pig on breeding costs, while those using commodity genetics spend $2 to $3.
Utilities and Miscellaneous (3–6%): Electricity, propane, water, insurance, and miscellaneous supplies typically total $5 to $10 per marketed pig depending on climate and facility design.
2026 Average Production Cost per Marketed Pig (280 lb)
| Cost Category | $ per Pig | % of Total | Range |
|---|---|---|---|
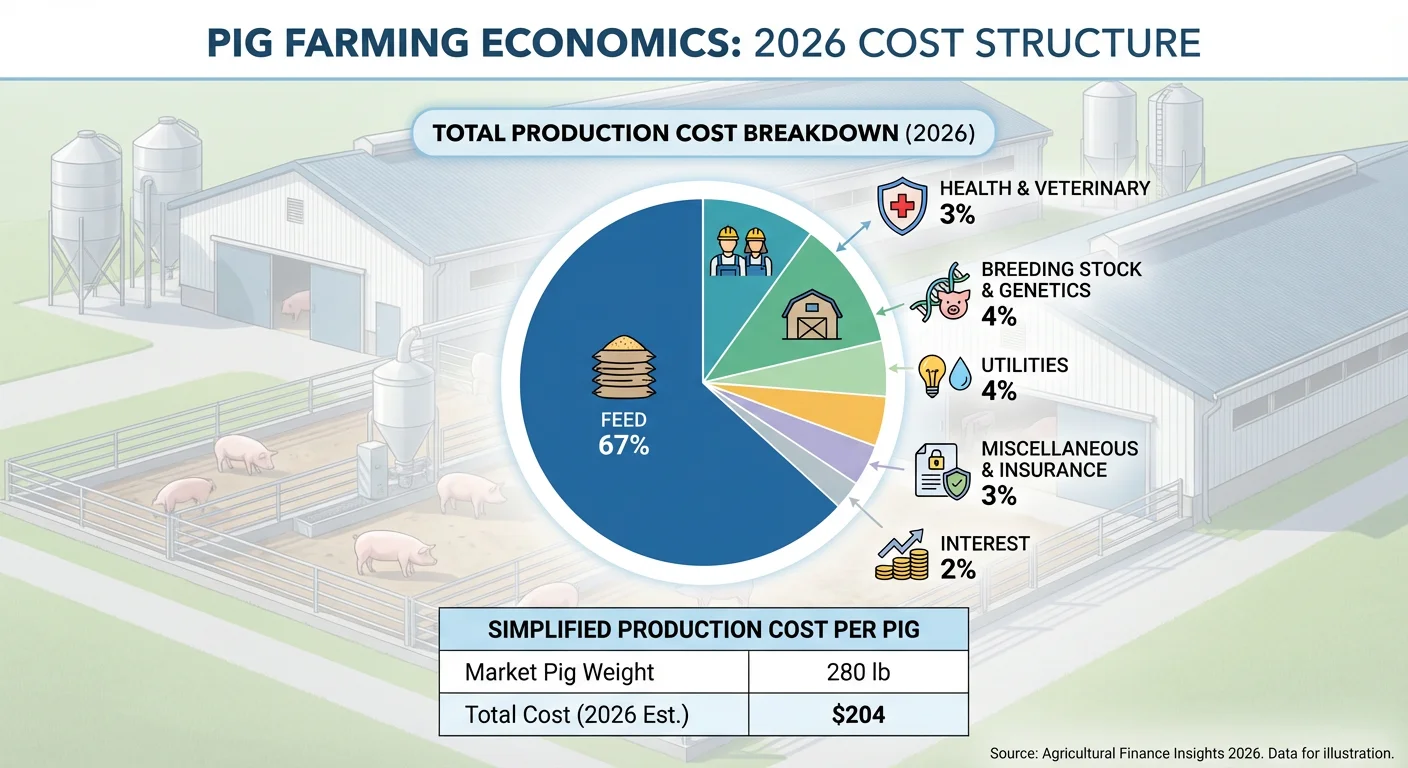
| Feed (all stages) | $138.00 | 67% | $120–165 |
| Labor | $18.00 | 9% | $8–25 |
| Housing & Facilities | $16.00 | 8% | $10–22 |
| Health & Veterinary | $6.00 | 3% | $4–12 |
| Breeding Stock & Genetics | $8.00 | 4% | $5–12 |
| Utilities (electric, propane, water) | $8.00 | 4% | $5–12 |
| Miscellaneous & Insurance | $6.00 | 3% | $3–10 |
| Interest on Operating Capital | $4.00 | 2% | $2–8 |
| TOTAL COST | $204.00 | 100% | $175–250 |
Fixed vs Variable Costs in Pig Farming Economics
Understanding the distinction between fixed and variable costs informs operational decisions, particularly regarding production volume and capacity utilization.
Fixed Costs: Facility depreciation, property taxes, insurance, and base labor costs remain constant regardless of production volume. These costs continue whether facilities run at 100 percent or 50 percent capacity, making high utilization essential for cost efficiency in pig farming economics. Fixed costs typically represent 15 to 25 percent of total costs at full capacity.
Variable Costs: Feed, health supplies, utilities, and additional labor scale with production volume. These costs, representing 75 to 85 percent of total costs, only occur when pigs are present. Variable cost per pig remains relatively constant regardless of total production volume.
Operational Implications: Operations with high fixed costs should prioritize capacity utilization even at reduced margins rather than leaving facilities empty. Conversely, variable cost focus makes sense when evaluating whether to add production to existing capacity. Break-even analysis must separately consider fixed cost coverage versus variable cost recovery.
Cost Accumulation by Production Stage (2026)
| Stage | Weight (lb) | Feed Cost | Other Costs | Cumulative Total |
|---|---|---|---|---|
| Weaned Pig | 12–15 | $8 | $32 | $40 |
| Nursery Exit | 50–55 | $25 | $12 | $77 |
| Grower Exit | 120–130 | $45 | $10 | $132 |
| Market Weight | 280–290 | $60 | $12 | $204 |
Revenue Streams in Pig Farming Economics
Revenue optimization requires understanding pricing mechanisms, market channels, and value-added opportunities. While most operations rely primarily on market pig sales, diversified revenue streams reduce risk and may improve margins—a key consideration in pig farming economics.
Market Pig Sales
Market hog sales generate 90 to 95 percent of revenue for typical commercial operations. Understanding pricing structures enables marketing decisions that maximize value.
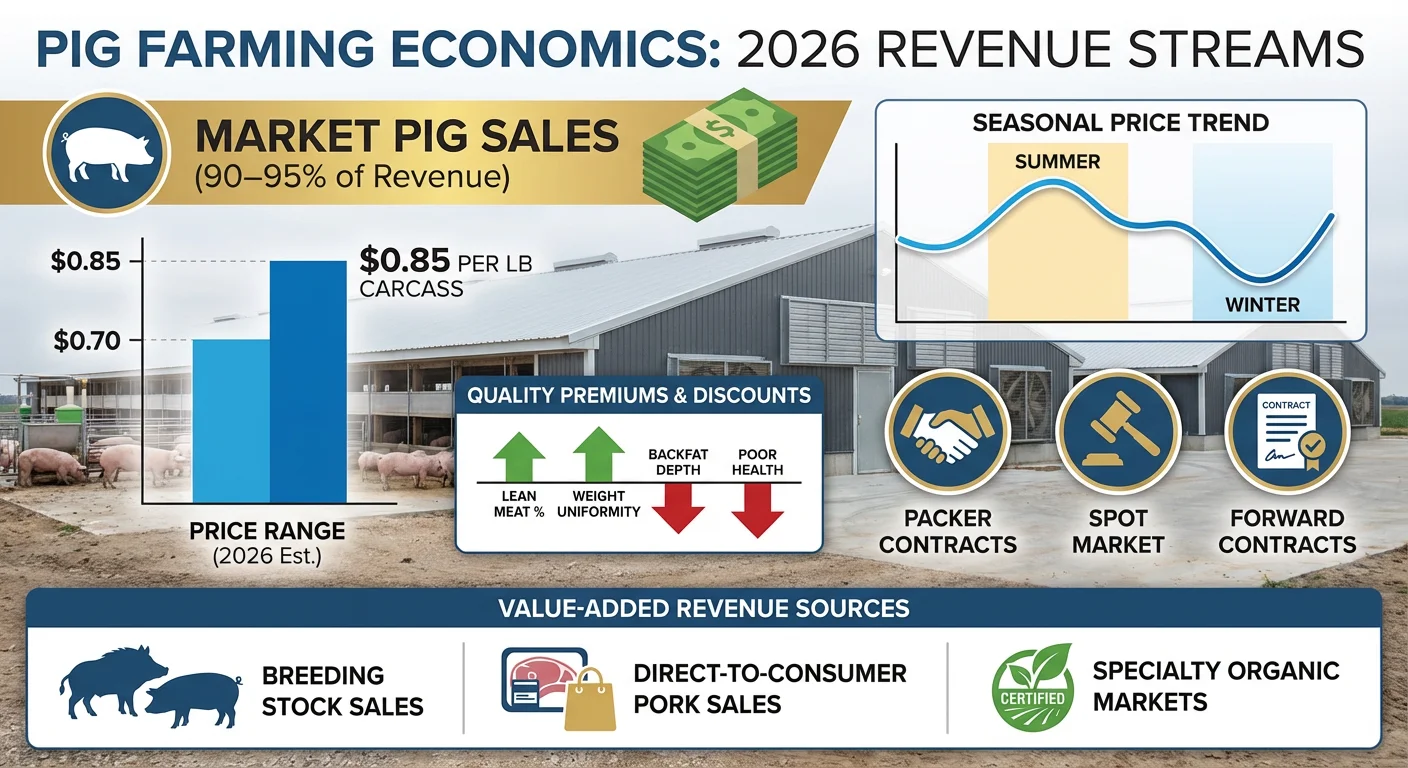
2026 Price Expectations: Lean hog prices in 2026 project to average $0.70 to $0.85 per pound carcass weight, translating to approximately $145 to $175 per 210-pound carcass. Live weight equivalent pricing runs $0.52 to $0.64 per pound, or $145 to $180 per 280-pound market hog. Seasonal variation typically sees summer prices $0.05 to $0.10 higher than winter lows, according to the USDA Hogs & Pork market outlook.
Quality Premiums: Grid pricing rewards carcasses meeting optimal specifications. Lean percentage premiums pay $1 to $3 per hundredweight for carcasses exceeding 52 percent lean. Weight premiums favor carcasses in the 195 to 220 pound range. Conversely, discounts penalize undersized, oversized, or excessively fat carcasses by $3 to $8 per hundredweight.
Marketing Channels: Packer contracts provide price stability through formula pricing tied to cutout values or futures markets. Spot market sales offer flexibility but expose operations to daily price volatility. Forward contracting locks in prices for future delivery, reducing both upside opportunity and downside risk.
Value-Added Revenue Opportunities
Breeding Stock Sales: Operations selling registered or commercial breeding stock capture significant value premiums. Quality gilts sell for $300 to $600 versus $150 to $180 market value, while boars command $400 to $2,000 depending on genetics and testing. This market requires genetic investment, health certification, and sales infrastructure.
Direct-to-Consumer Sales: Selling whole, half, or cut pork directly to consumers bypasses commodity pricing. Whole hog pricing at $3.50 to $5.00 per pound hanging weight generates $650 to $950 per animal versus $150 to $180 at commodity prices. Processing costs, marketing effort, and regulatory compliance offset some of this premium.
Specialty and Organic: Organic certification, heritage breeds, or pasture-raised production access premium markets paying 50 to 200 percent above conventional prices. Higher production costs and lower efficiency partially offset premiums, but strong margins remain possible with effective marketing.
Profitability Analysis: The Heart of Pig Farming Economics
Profitability in pig farming economics depends on the margin between revenue and total costs, influenced by efficiency, market timing, and cost management. Understanding profit drivers enables targeted improvement efforts.
Margin Calculations
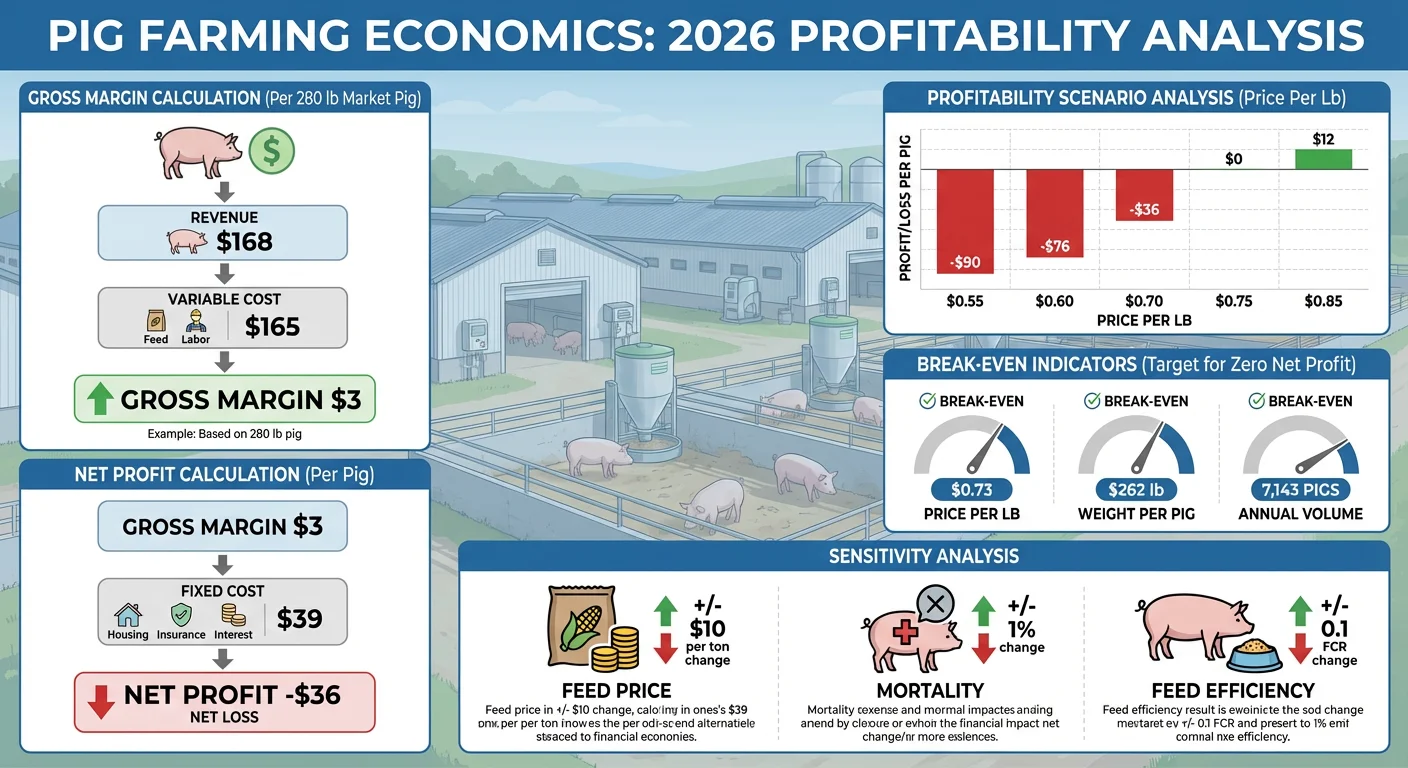
Gross Margin: Revenue minus variable costs equals gross margin, indicating profitability before fixed cost consideration. A 280-pound market pig selling for $168 (at $0.60/lb) with $165 variable costs generates $3 gross margin per pig. This margin must cover fixed costs before generating profit.
Net Profit: Gross margin minus fixed costs equals net profit. With $39 fixed costs per pig ($204 total – $165 variable), the example pig loses $36 per head. Profitable operations require either higher revenue (better prices or heavier weights), lower variable costs (improved efficiency), or lower fixed costs (higher throughput spreading fixed costs).
2026 Profitability Scenarios by Market Conditions
| Scenario | Price/lb | Revenue | Total Cost | Profit/Loss |
|---|---|---|---|---|
| Weak Market | $0.55 | $154 | $204 | ($50) |
| Below Average | $0.65 | $182 | $204 | ($22) |
| Break-Even | $0.73 | $204 | $204 | $0 |
| Average Market | $0.78 | $218 | $204 | $14 |
| Strong Market | $0.85 | $238 | $204 | $34 |
Break-Even Analysis in Pig Farming Economics
Break-even analysis identifies the minimum price, weight, or volume required to cover costs. This information guides marketing decisions and provides perspective on risk exposure.
Price Break-Even: With $204 total cost and 280-pound market weight, break-even price equals $0.73 per pound live weight. Operations with lower costs achieve profitability at lower prices, providing competitive advantage during market downturns.
Weight Break-Even: At $0.78 per pound market price, break-even weight equals 262 pounds ($204 ÷ $0.78). Pigs marketed lighter than this weight fail to cover costs regardless of feed savings from shorter feeding periods.
Volume Break-Even: Fixed costs must be covered before any production generates profit. An operation with $100,000 annual fixed costs and $14 per-pig profit margin requires 7,143 pigs annually to break even on fixed costs ($100,000 ÷ $14).
Sensitivity to Key Variables
Feed Price Impact: Each $0.01 per pound change in feed cost translates to approximately $7 per marketed pig (700 pounds feed × $0.01). A $50 per ton ($0.025/lb) feed price increase adds $17.50 to production costs, potentially converting profits to losses.
Mortality Impact: Each 1 percent increase in mortality adds approximately $2.50 to $3.00 per marketed pig through lost investment in dead animals. A 5 percent mortality rate versus 2 percent adds $7.50 to $9.00 per survivor.
Feed Efficiency Impact: Improving feed conversion from 2.9 to 2.7 saves 55 pounds of feed per pig (2.9 – 2.7 = 0.2 × 275 pounds gain), worth $10 to $12 at current feed prices. This single metric dramatically affects pig farming economics.
Financial Planning and Budgeting for Pig Farming Economics
Systematic financial planning enables proactive management rather than reactive crisis response. Pig farming economics requires forward-looking budgets that anticipate cash needs, guide capital allocation, and establish performance benchmarks.
Production Budgeting
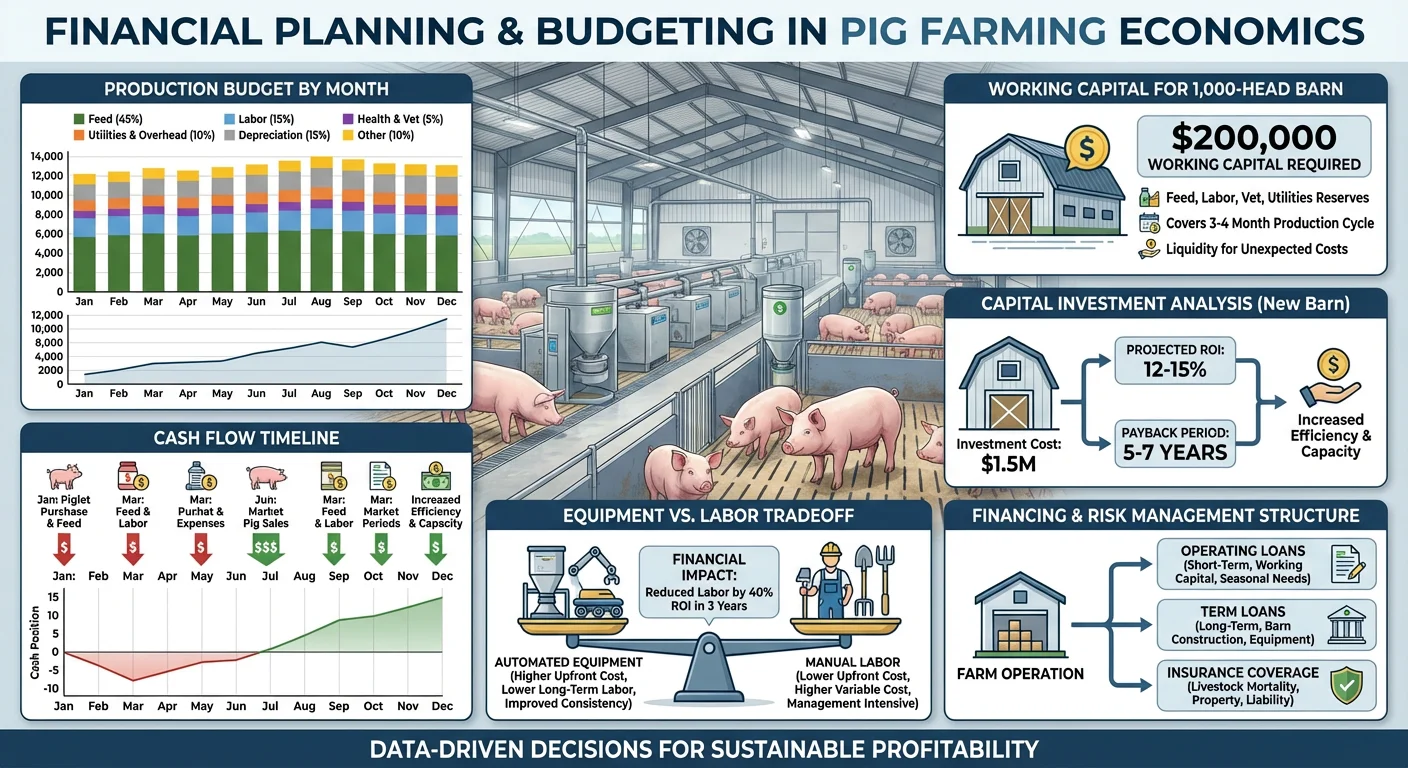
Annual Production Budget: Develop budgets projecting pig flow, input costs, and expected revenue by month or quarter. Base projections on historical performance adjusted for anticipated changes in genetics, management, or market conditions. Include sensitivity analysis showing outcomes under different price and cost scenarios.
Cash Flow Forecasting: Map expected cash inflows (pig sales) against cash outflows (feed, labor, loan payments) across time. Pig production creates timing mismatches—expenses occur continuously while revenue arrives when pigs reach market. Cash flow forecasting identifies periods requiring credit line access or reserve utilization.
Working Capital Needs: Pig finishing typically requires 4 to 5 months of working capital investment before the first pigs reach market. A 1,000-head finishing barn requires approximately $200,000 in working capital ($200 per pig) to cover costs until revenue begins. Breeding operations need even longer capital horizons.
Capital Investment Planning
Facility Investment Analysis: Evaluate building investments using net present value or internal rate of return metrics. A $400,000 barn producing 5,000 pigs annually at $20 per-pig profit generates $100,000 annual return, suggesting 4-year simple payback before considering capital costs and risk.
Equipment vs Labor Tradeoffs: Automation investments should demonstrate positive return through labor savings and efficiency gains. A $50,000 automated feeding system saving 0.5 hours daily at $20 per hour saves $3,650 annually—requiring 14 years for payback unless efficiency gains add additional value.
Financing Considerations
Operating Loans: Lines of credit provide working capital flexibility, with interest paid only on amounts drawn. Interest rates in 2026 run 7 to 10 percent for qualified agricultural borrowers. Credit line limits should exceed anticipated maximum needs to buffer unexpected requirements.
Term Loans: Facility and equipment purchases typically use term financing with 7 to 20 year amortization. Loan terms should match asset useful life—20-year terms for buildings, 7 to 10 years for equipment. Current rates run 7 to 9 percent for qualified borrowers.
Insurance Planning: Property insurance protects facility investment against fire, storm, and other perils. Livestock mortality insurance covers death losses from covered events. Business interruption coverage addresses revenue loss during recovery from covered events. Livestock Risk Protection (LRP) insurance provides price protection against market declines.
Cost Reduction Strategies in Pig Farming Economics
Cost reduction provides the most reliable path to improved profitability in pig farming economics. Unlike revenue enhancement (dependent on market conditions), cost reduction is substantially within management control.
Feed Efficiency Optimization
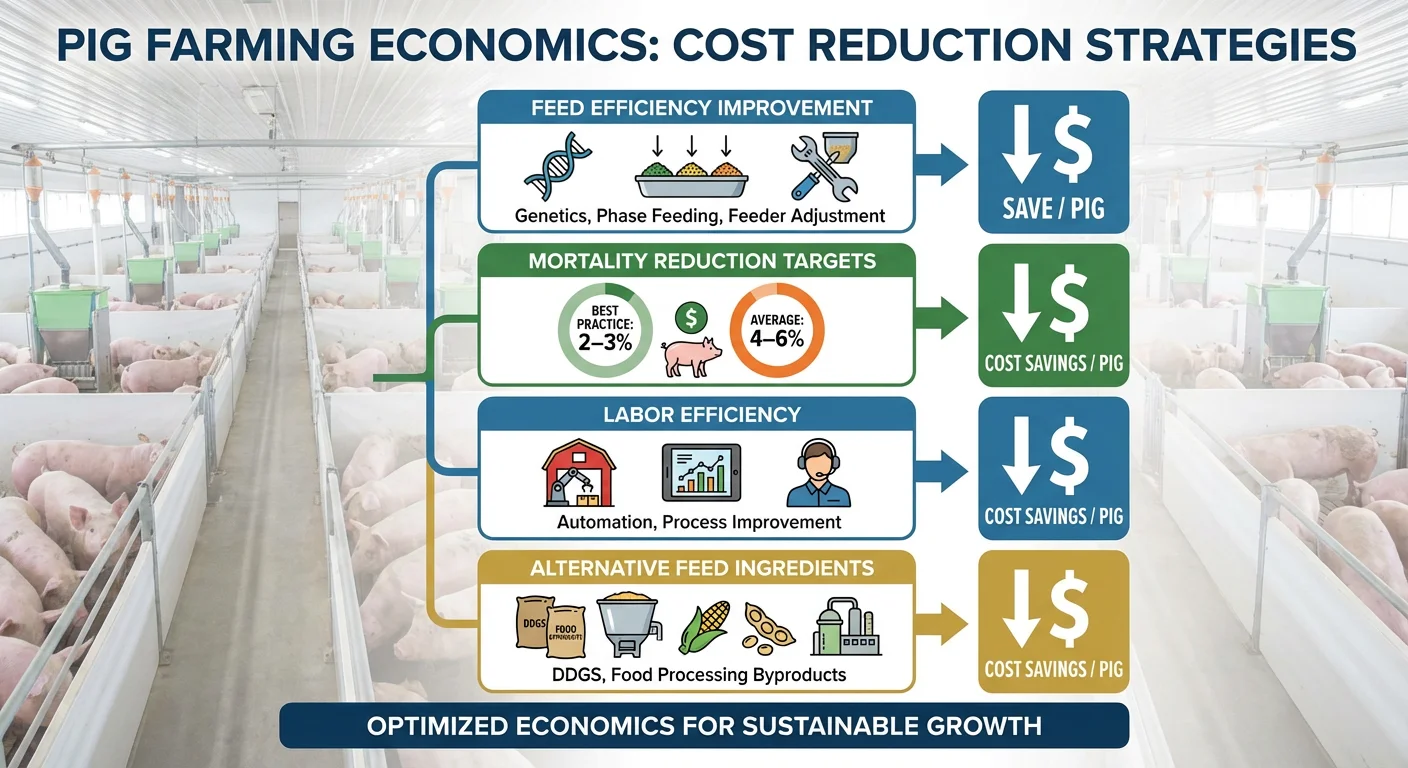
Feed represents the largest cost category, making feed efficiency optimization the highest-leverage improvement opportunity in pig farming economics. Small improvements compound into significant savings across large pig numbers.
Genetic Selection: Modern genetics show feed conversion ratios 0.3 to 0.5 units better than genetics from 10 years ago. Investing in superior genetics adds $3 to $5 per pig in breeding costs but saves $15 to $25 in feed—a compelling return.
Phase Feeding: Matching diet formulation to changing nutrient requirements across growth phases prevents overfeeding expensive nutrients. Implementing four finishing phases versus two saves $3 to $5 per pig through more precise nutrition without affecting performance.
Feeder Management: Properly adjusted feeders reduce feed waste by 2 to 4 percent. With 700 pounds of feed per pig, this prevents 14 to 28 pounds of waste worth $3 to $6 per pig. Regular feeder audits and adjustment protocols capture this value.
Mortality and Morbidity Reduction
Dead pigs generate zero revenue while consuming resources invested before death. Reducing mortality directly improves profitability while also indicating improved animal welfare.
Target Mortality Rates: Top-performing operations achieve 2 to 3 percent mortality from weaning to market. Average operations run 4 to 6 percent. Each percentage point improvement saves $2.50 to $3.00 per marketed pig.
Health Investment Returns: Vaccination costing $1.50 per pig that reduces mortality by 1 percent returns the investment plus $1 to $1.50 additional profit. Health investments should be evaluated by their expected return, not absolute cost.
Labor Efficiency
Labor costs continue rising, making labor efficiency increasingly important in pig farming economics. Automation and process improvement reduce labor requirements per pig produced.
Automation Opportunities: Automated feeding, environmental control, and monitoring systems reduce daily labor requirements by 30 to 50 percent in many applications. Capital investment must be justified by labor savings, efficiency gains, or improved performance.
Process Improvement: Efficient facility layout, appropriate equipment, and standardized procedures improve labor productivity without capital investment. Time studies identifying waste and inefficiency often reveal significant improvement opportunities.
Alternative Feed Ingredients
Local byproducts and alternative ingredients can reduce feed costs when properly formulated and managed.
DDGS (Distillers Dried Grains): Ethanol byproduct providing protein and energy at competitive prices. Inclusion rates of 15 to 20 percent in finishing diets reduce feed costs $3 to $6 per pig when DDGS prices favor substitution.
Food Processing Byproducts: Bakery waste, candy waste, and other food processing byproducts offer energy at $0.03 to $0.08 per pound versus $0.10 to $0.12 for corn. Transportation logistics and consistency limit availability to operations near processing facilities.
Profitability by Production Model in Pig Farming Economics
Different production models present distinct economic profiles within pig farming economics. Scale, market channel, and production intensity all affect cost structure and revenue potential.
Expected Returns by Production Model (2026)
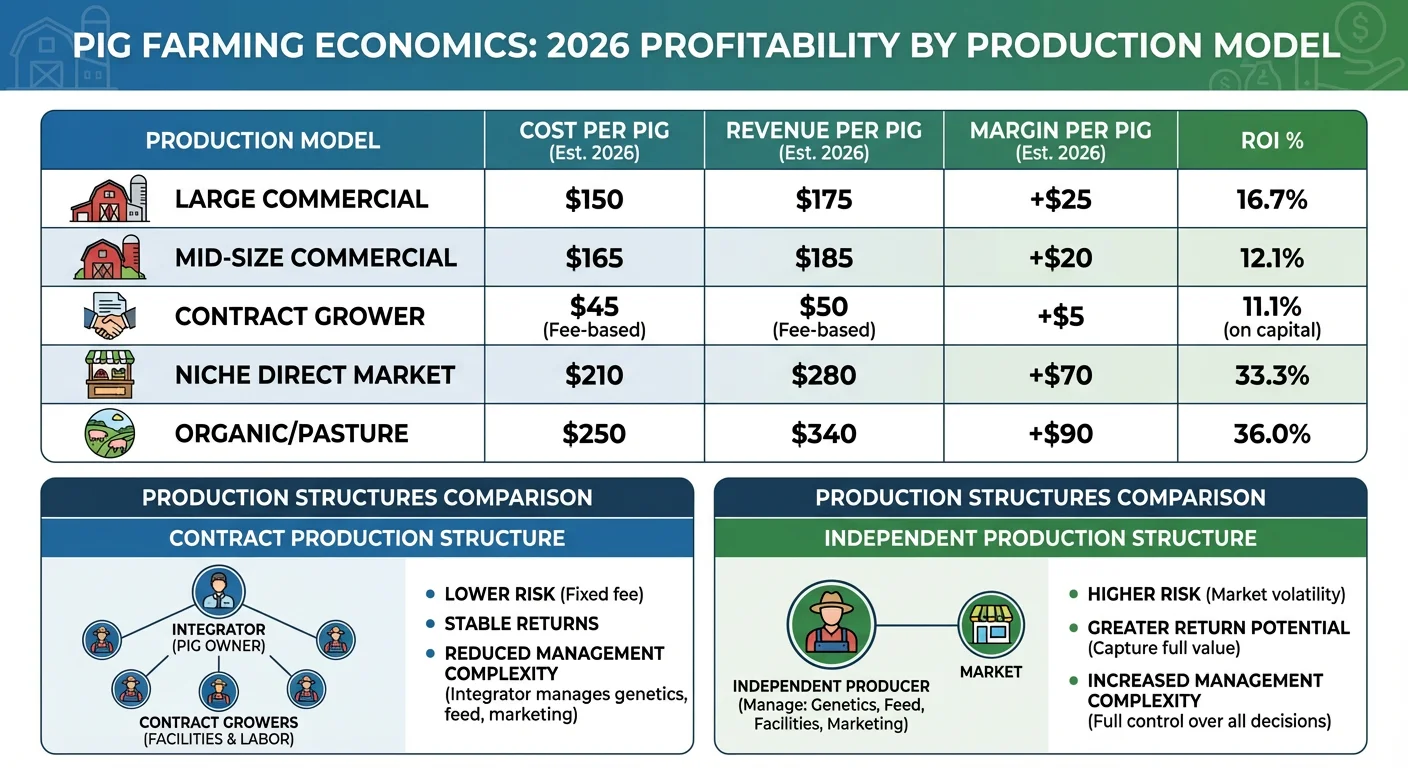
| Model | Scale | Cost/Pig | Revenue | Margin | ROI |
|---|---|---|---|---|---|
| Large Commercial | 50,000+/yr | $185–200 | $215–230 | $20–35 | 12–18% |
| Mid-Size Commercial | 5,000–20,000 | $195–215 | $210–225 | $10–20 | 8–12% |
| Contract Grower | 2,400–5,000 | $18–25* | $45–55* | $25–35* | 6–10% |
| Niche/Direct Market | 50–500/yr | $250–350 | $450–750 | $150–400 | 15–40% |
| Organic/Pasture | 100–1,000 | $350–450 | $550–900 | $150–450 | 12–25% |
*Contract grower costs/revenue reflect grower’s portion only; integrator owns pigs and provides feed
Contract vs Independent Production
Contract Production: Contract growers provide facilities and labor while integrators supply pigs, feed, veterinary services, and marketing. Growers receive per-pig or per-pound payments averaging $45 to $55 per pig space per year. Lower risk and reduced management complexity offset limited upside potential.
Independent Production: Independent producers own pigs and control all decisions, capturing full market upside but bearing complete downside risk. Higher potential returns require greater management capability and risk tolerance. Market access and price negotiating power favor larger independents.
Risk Management in Pig Farming Economics
Risk management protects operations from events that could otherwise threaten financial viability. Pig farming economics involves inherent volatility requiring systematic approaches to manage exposure.
Price Risk
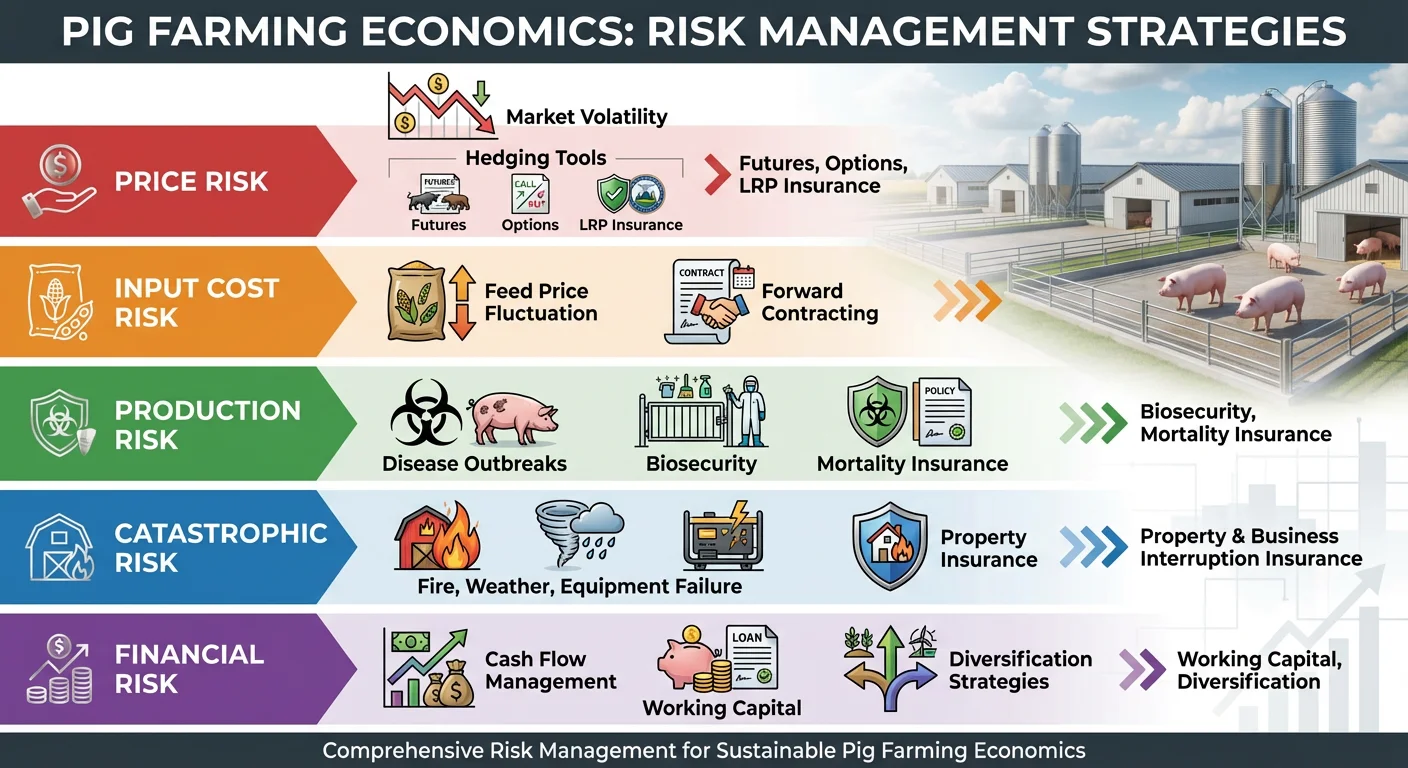
Market Price Volatility: Lean hog prices can swing 30 to 50 percent within a year, dramatically affecting profitability. Operations profitable at $0.85 per pound may lose money at $0.60. Hedging through futures contracts, options, or LRP insurance can lock in prices, sacrificing upside potential for downside protection.
Input Cost Risk: Feed prices fluctuate with corn and soybean markets, affecting the largest cost category. Forward contracting feed ingredients, using feed price hedging, or maintaining inventory during price dips can reduce input cost volatility.
Production Risk
Disease Outbreaks: Major disease events can devastate profitability through mortality, reduced performance, and extended recovery periods. Biosecurity investment provides the primary defense. Livestock mortality insurance covers death losses from many (not all) disease events.
Catastrophic Events: Fire, weather events, and equipment failures can destroy facilities or kill animals. Property and livestock insurance provide financial recovery for covered events. Business interruption coverage addresses revenue loss during recovery.
Financial Risk
Cash Flow Management: Maintaining adequate working capital and credit access provides buffer against temporary downturns. Operations entering market downturns with excessive debt or inadequate reserves face survival pressure that well-capitalized competitors can ride out.
Diversification: Revenue diversification through multiple market channels, customer relationships, or enterprise types reduces dependence on any single revenue stream. Cost diversification through multiple feed suppliers or genetic sources protects against single-source disruption.
Technology and Data in Pig Farming Economics
Technology increasingly enables data-driven decision-making in pig farming economics. Information systems that track costs, performance, and profitability provide the foundation for continuous improvement.
Farm Management Software
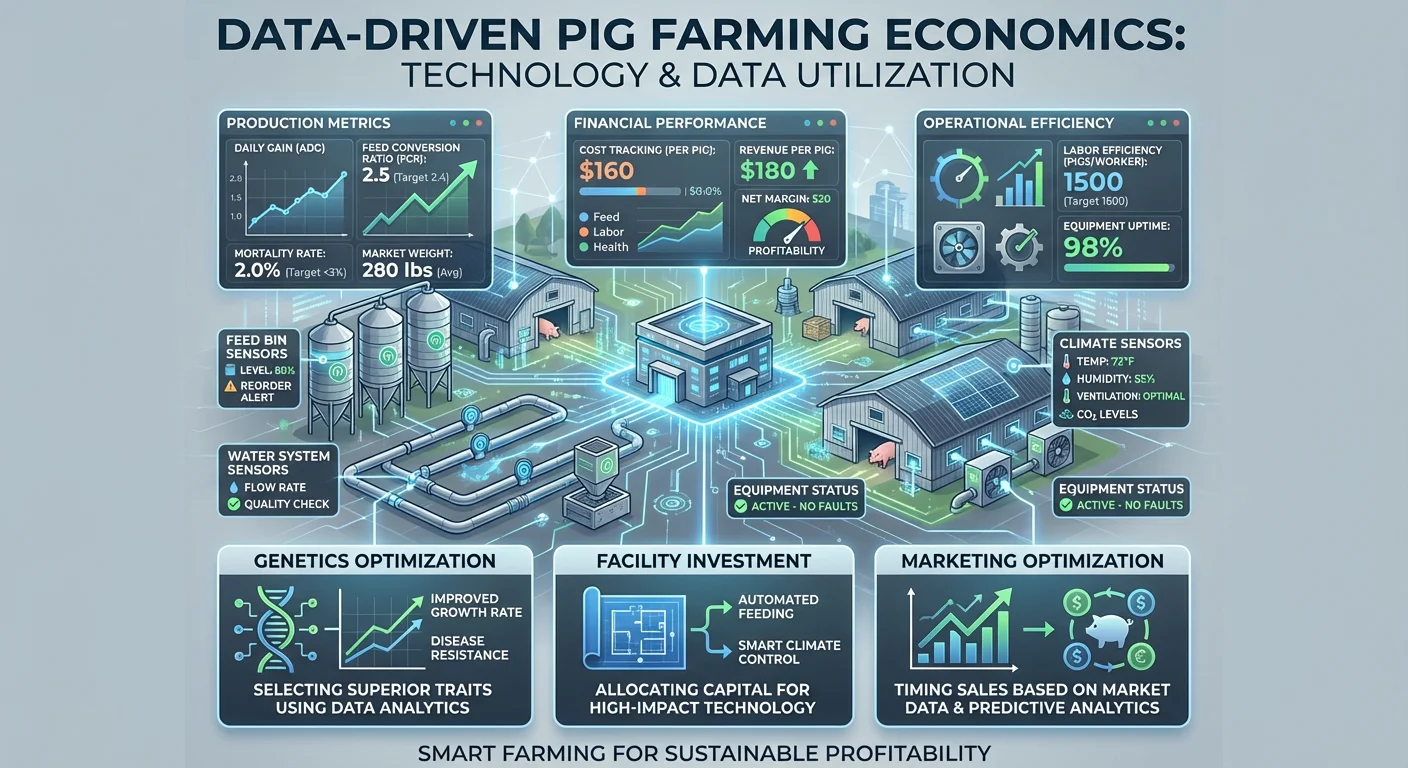
Modern farm management software tracks production metrics, costs, and financial performance at individual animal or group levels. Integration across breeding, feeding, and health systems provides comprehensive operational visibility.
Key Metrics to Track: Feed conversion by group and barn, mortality by source and cause, cost per pound of gain, revenue per pig, margin by customer or market channel, and labor cost per pig. Regular reporting enables rapid problem identification and performance benchmarking.
IoT and Smart Monitoring
Internet of Things sensors enable real-time monitoring of environmental conditions, feed consumption, water usage, and equipment status. Alerts identify problems before they cause significant losses.
Feed Monitoring: Automated feed delivery systems track consumption by bin and barn, enabling feed conversion calculation without manual weighing. Consumption deviations from expected patterns may indicate health problems before clinical signs appear.
Environmental Monitoring: Temperature, humidity, and air quality sensors ensure optimal growing conditions while alerting to equipment failures. Early detection of ventilation problems can prevent heat stress mortality during summer months.
Data-Driven Decisions
Accumulated data enables analysis supporting strategic decisions about genetics, facility investment, marketing timing, and operational changes. Operations with good data make better decisions than those relying on intuition alone.
Genetic Selection: Tracking progeny performance by sire enables genetic evaluation and selection decisions based on actual production outcomes rather than expected values alone.
Marketing Optimization: Analyzing price patterns, sort loss history, and weight-value relationships enables marketing decisions that maximize revenue rather than simply moving pigs when space requires.
Sustainability and Long-Term Planning in Pig Farming Economics
Sustainability considerations increasingly affect pig farming economics through regulatory compliance, market access requirements, and operational efficiency opportunities.
Environmental Compliance
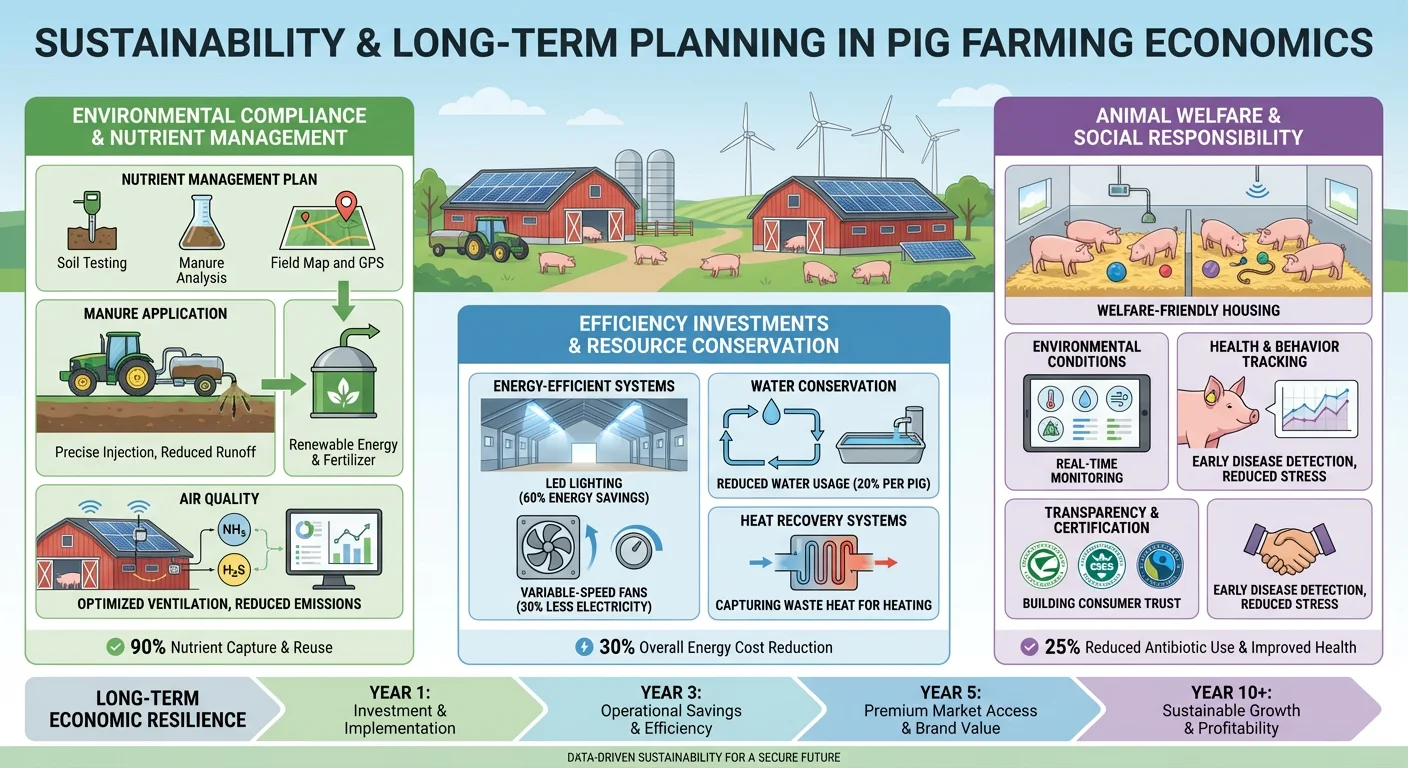
Nutrient Management: Regulations governing manure application require nutrient management planning, adequate land base, and application record-keeping. Compliance costs include planning services, soil testing, and potentially land lease for manure application rights. Non-compliance risks fines and operating restrictions.
Air Quality: Odor and emissions regulations vary by state but increasingly affect site selection and neighbor relations. Mitigation technologies add cost while enabling operation in more constrained locations.
Efficiency Investments
Energy Efficiency: LED lighting, variable-speed fans, and heat recovery systems reduce energy costs 20 to 40 percent compared to older technologies. Investment payback typically runs 2 to 5 years depending on utility rates and usage patterns.
Water Conservation: Water-saving equipment and leak detection reduce water costs while demonstrating environmental stewardship. Benefits include reduced wastewater volume requiring management.
Welfare and Market Access
Animal welfare increasingly affects market access as major buyers require certification or documentation. Investment in welfare improvements may be necessary for market retention while potentially enabling premium positioning.
Small-Scale and Hobby Farm Economics
Small-scale pig farming economics operates differently than commercial production. Economies of scale disadvantage small operations on cost, but premium market access and lifestyle benefits offset these challenges.
Cost Challenges and Solutions
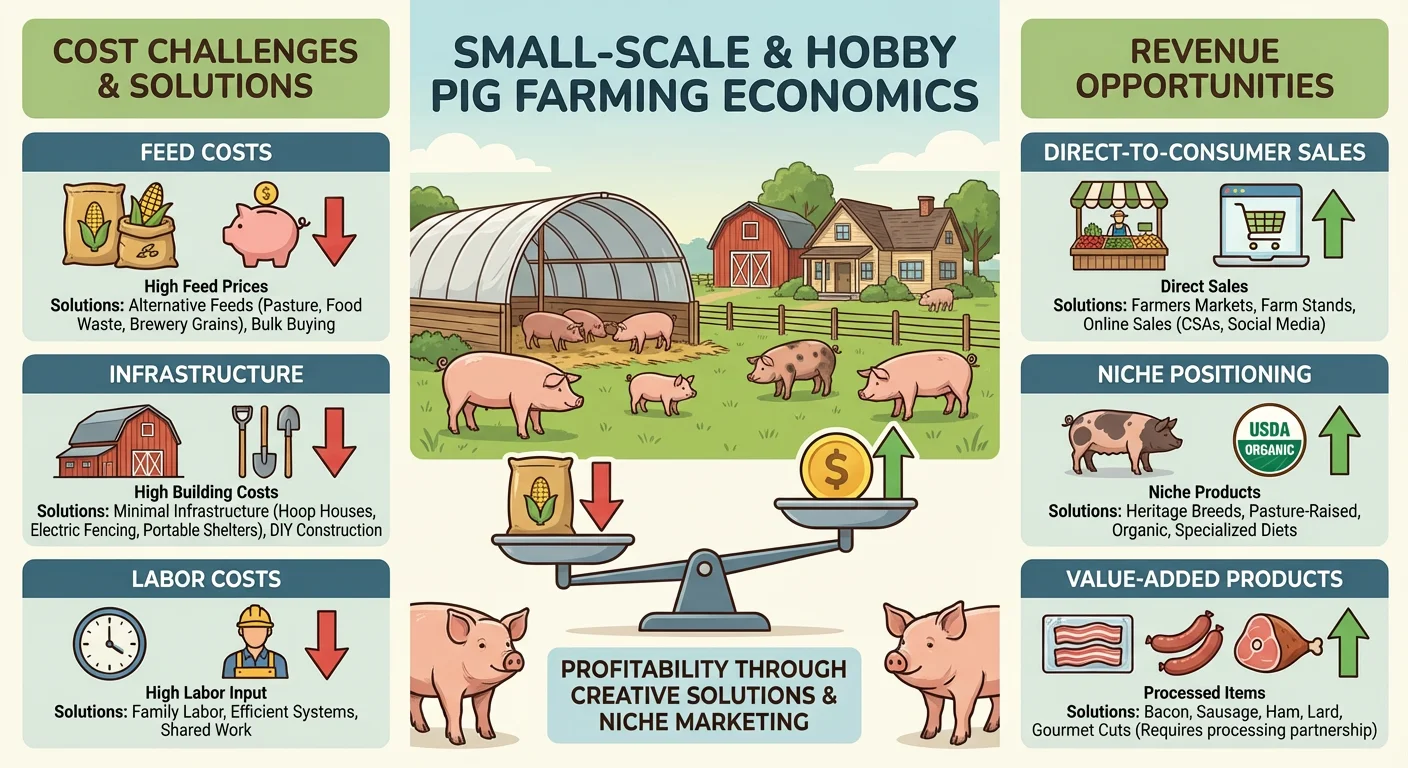
Scale Disadvantage: Small operations pay retail for inputs that commercial operations purchase at volume discounts. Feed costs $50 to $100 per ton higher, equipment costs more per unit capacity, and labor cannot spread across enough animals for efficiency.
Offsetting Strategies: Alternative feeds including bakery waste, produce culls, and food processing byproducts reduce feed costs. Minimal infrastructure using hoop houses or converted buildings reduces capital requirements. Family labor at below-market rates improves apparent economics.
Revenue Opportunities
Direct Marketing: Selling whole or half hogs directly to consumers at $3.50 to $5.00 per pound hanging weight generates $650 to $950 per pig versus $150 to $180 at commodity prices. Marketing effort and customer development required.
Niche Positioning: Heritage breeds, pasture-raised production, or organic certification access premium markets. Higher production costs are offset by premium pricing when marketing effectively reaches target customers.
Value-Added Products: On-farm processing into bacon, sausage, or specialty products captures additional value. Regulatory compliance and food safety requirements must be addressed. Returns can be excellent for operations with processing capability and market access.
Frequently Asked Questions About Pig Farming Economics
How much does it cost to raise a pig to market weight?
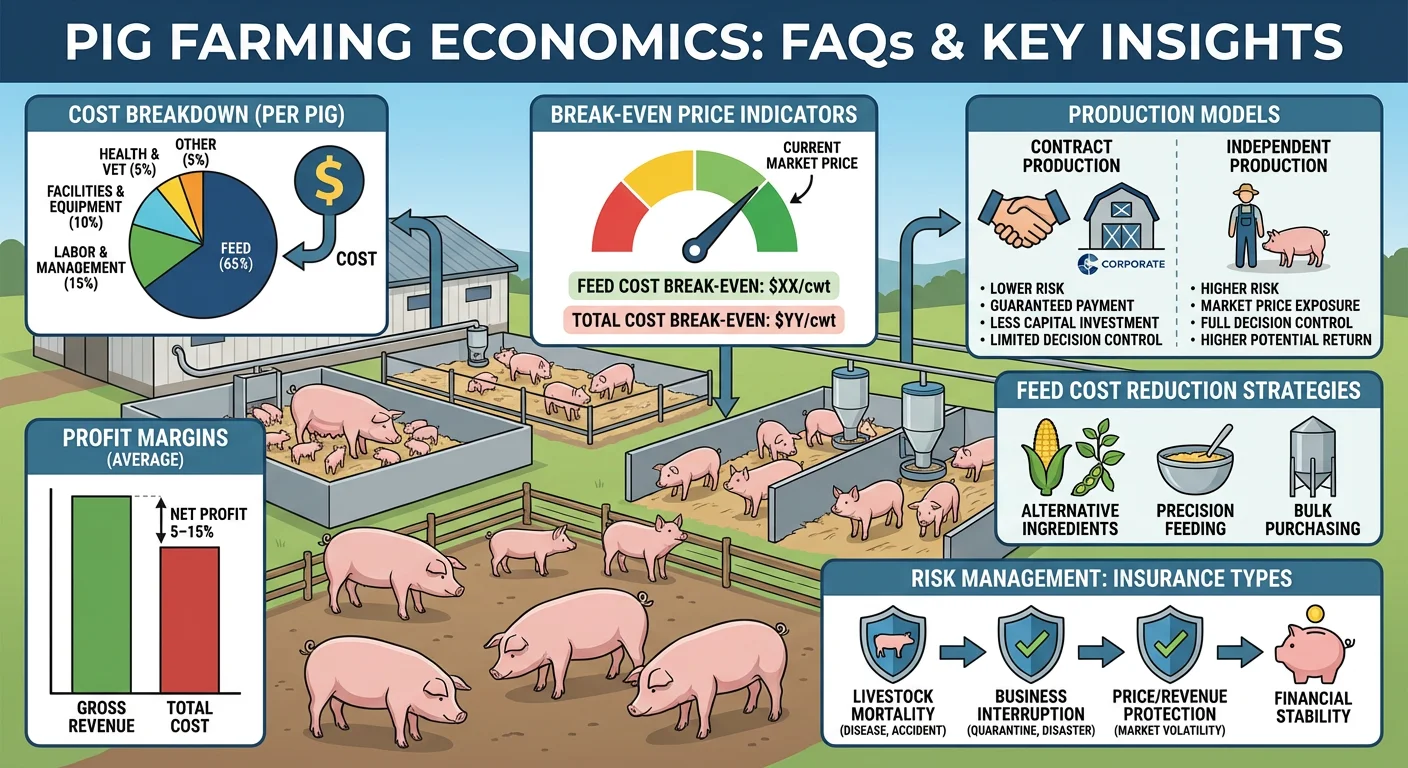
According to pig farming economics data, total costs to raise a pig from weaning to market weight (280 pounds) average $175 to $250 depending on operation efficiency, feed prices, and overhead allocation. Feed typically accounts for $120 to $165 of this total. Small operations with higher per-unit costs may spend $250 to $350 per pig.
What is the profit margin on a market pig?
Profit margins in pig farming economics vary dramatically with market conditions and operation efficiency. Average commercial operations earn $10 to $25 per pig during typical markets, with top performers achieving $25 to $40. Margins can range from losses exceeding $50 per pig during market downturns to profits above $50 during strong markets.
How many pigs do I need to make a living from pig farming economics?
At $20 per-pig profit margin, generating $50,000 income requires marketing 2,500 pigs annually. At $15 margin, this increases to 3,333 pigs. Most full-time independent pig operations market 3,000 to 10,000 pigs annually. Smaller operations typically supplement other income sources or rely on premium direct-market pricing for adequate returns.
Is pig farming profitable in 2026?
Based on current pig farming economics, well-managed operations remain profitable in 2026, though margins have compressed from 2014–2019 levels. Operations with strong feed efficiency, low mortality, and good market access continue generating positive returns. Marginal operations with poor efficiency or high costs struggle to break even during weak market periods.
What is the break-even price for pigs in pig farming economics?
Break-even price depends on individual operation costs. Average commercial operations break even at approximately $0.70 to $0.75 per pound live weight, or roughly $195 to $210 per 280-pound pig. Efficient operations may break even at $0.65 per pound, while high-cost operations need $0.80 or higher.
Should I raise pigs on contract or independently?
Understanding pig farming economics helps make this decision. Contract production offers lower risk, stable income, and reduced management complexity—suitable for operations prioritizing predictability. Independent production offers higher potential returns but with greater risk and management requirements. Decision factors include risk tolerance, available capital, management capability, and market access.
How can I reduce feed costs in pig production?
Feed cost reduction is crucial in pig farming economics. Strategies include improving genetics for better feed conversion, implementing phase feeding to match nutrition to requirements, properly adjusting feeders to reduce waste, sourcing alternative ingredients when economically favorable, and maintaining optimal health to prevent feed efficiency losses from subclinical disease.
What insurance do pig farmers need?
Essential coverage for protecting your pig farming economics includes property insurance for facilities and equipment, liability insurance, and typically livestock mortality insurance. Many operations also use Livestock Risk Protection (LRP) insurance for price protection. Business interruption coverage addresses revenue loss during recovery from covered events. Workers compensation is required for employees in most states.
Conclusion: Mastering Pig Farming Economics in 2026
Pig farming economics ultimately determines which operations succeed and which struggle, making financial management as essential as animal husbandry for sustainable pork production. Understanding cost structures, optimizing efficiency, managing risks, and capturing value through appropriate market channels together create the foundation for profitability.
The 2026 economic environment rewards operations that excel at efficiency. With feed representing 65 to 70 percent of costs, feed efficiency improvement offers the highest-leverage opportunity for profit enhancement in pig farming economics. A 0.1 improvement in feed conversion saves $5 to $6 per pig—often the difference between profit and loss.
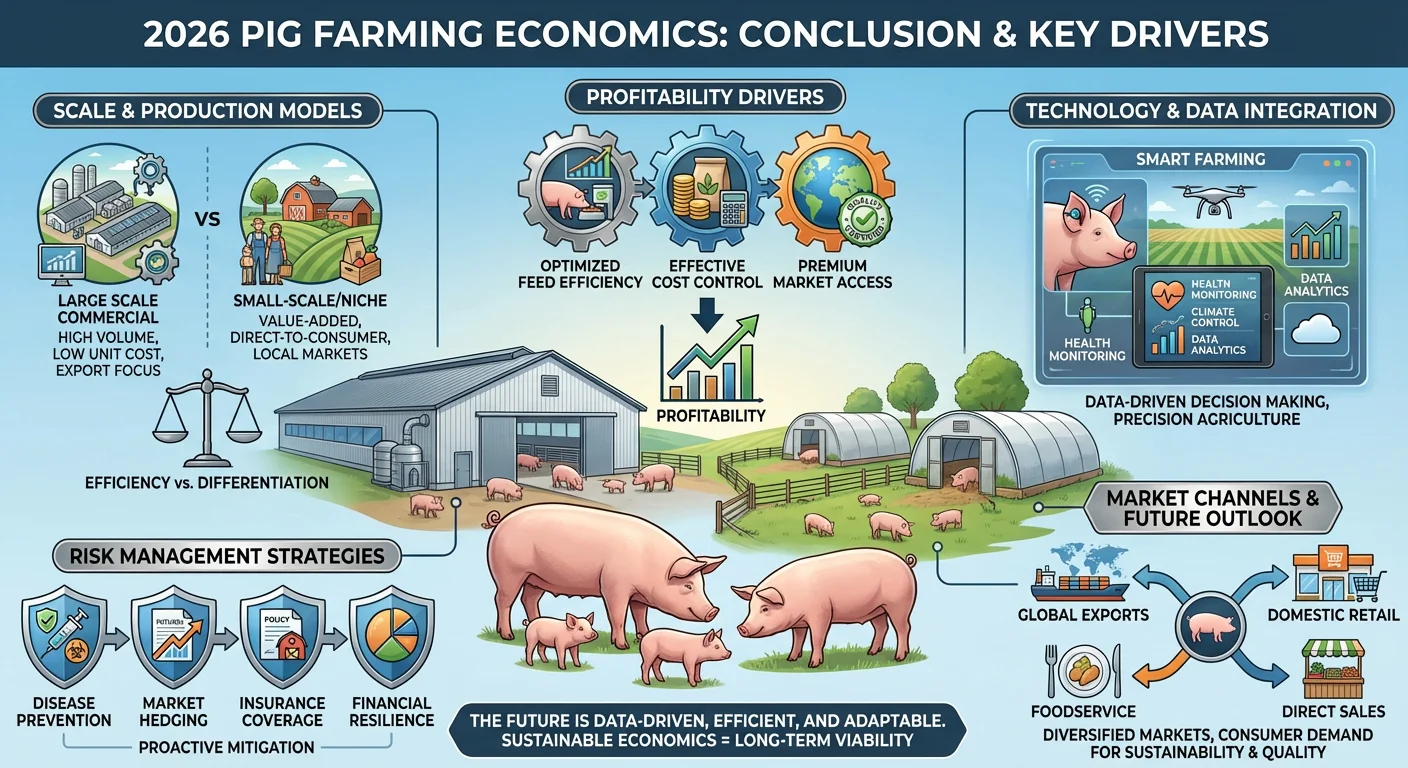
Scale matters but is not determinative in pig farming economics. Large commercial operations achieve cost advantages through volume purchasing and overhead dilution. However, small operations accessing premium markets can achieve margins per pig that exceed large-operation profits despite higher costs. Success requires matching scale to market channel and management capability.
Risk management increasingly separates survivors from casualties. Price volatility, disease threats, and input cost fluctuations create exposure that unmanaged can threaten operation viability. Hedging strategies, insurance programs, working capital reserves, and diversification provide protection enabling operations to survive challenges that overwhelm unprotected competitors.
Looking forward, technology and data will increasingly differentiate profitable operations in pig farming economics. Real-time monitoring, comprehensive record-keeping, and analytical capabilities enable optimization impossible with traditional management approaches. Operations investing in these capabilities today build competitive advantages that compound over time.
The fundamental economics of pig production remain favorable for well-managed operations. Global protein demand continues growing, U.S. pork maintains competitive production costs, and export markets provide additional outlets beyond domestic consumption. Operations combining excellent animal husbandry with sound pig farming economics will continue thriving in the 2026 U.S. pork industry.
