Pig Feed Formulation Basics
Introduction
After 20+ years running a 5,000-head operation in North Carolina, I can tell you that learning to formulate your own pig feed is one of the most valuable skills a producer can develop. According to USDA Economic Research Service data from 2024, feed represents 60-70% of total pig production costs, and properly formulated diets can improve feed conversion by 5-8% compared to poorly balanced rations—translating to $8-12 savings per market hog. Understanding how to create nutritionally balanced pig diets that match your pigs’ needs while minimising costs is essential for profitable commercial operations.
Feed formulation is both science and economics. The science involves meeting the pig’s nutritional requirements for energy, protein, amino acids, vitamins, and minerals at each growth stage.
The economics involves selecting the least-cost combination of available ingredients that meets those requirements while maintaining quality and palatability.
A well-formulated diet delivers every nutrient the pig needs—no more, no less—at the lowest possible cost.
Table of Contents
- Understanding Feed Formulation Principles
- Essential Nutrients and Their Requirements
- Common Feed Ingredients and Nutritional Profiles
- The Pearson Square Method for Simple Formulation
- Advanced Least-Cost Formulation Techniques
- Stage-Specific Diet Formulations
- Quality Control and Feed Testing
- Practical Formulation Example
- FAQ
Understanding Feed Formulation Principles
Feed formulation is the systematic process of combining available feed ingredients in specific proportions to meet the pig’s nutritional requirements while achieving production goals at minimum cost.
The fundamental principle underlying all formulation work is nutrient balance—the diet must supply adequate amounts of all essential nutrients in digestible, bioavailable forms that the pig can utilise efficiently.
The relationship between nutrient requirements and ingredient composition forms the mathematical foundation of formulation.
Requirements are what the pig needs based on its weight, growth rate, reproductive status, and the conditions in which it lives.
According to research from Iowa State University (2024), modern high-lean genetics require 15–20% more lysine per unit of energy than genetics from two decades ago.
Ingredient composition tells you what each feedstuff contributes—corn provides approximately 3,365 kcal ME/kg and 8.5% crude protein, while soybean meal delivers 2,230 kcal ME/kg and 47% crude protein.
The Concept of Digestibility
Modern formulation has shifted from total nutrient content to digestible nutrient systems. The National Research Council (NRC) Nutrient Requirements of Swine (12th Revised Edition) emphasises standardised ileal digestible (SID) amino acids rather than total amino acids.
This distinction is critical: a 16% crude protein diet using highly digestible soybean meal (88% digestible) outperforms an 18% crude protein diet using poorly digestible feather meal (75% digestible) because only absorbed nutrients contribute to growth and maintenance.
Research from the University of Illinois (2025) demonstrated that formulating digestible lysine rather than total lysine improved feed conversion by 4-6% while actually reducing diet costs by $2-4 per tonne through reduced crude protein requirements. The digestibility coefficients for common feedstuffs are well-established through decades of research and should guide all formulation decisions.
Least-Cost Linear Programming
Commercial feed formulation uses least-cost linear programming, a mathematical optimisation technique that finds the cheapest mix of ingredients that meets all nutritional constraints.
The algorithm evaluates thousands of potential ingredient combinations simultaneously, selecting the optimal solution based on current ingredient prices and availability.
Dr Hans Stein at the University of Illinois notes in his 2024 swine nutrition symposium proceedings that least-cost formulation can save $3-8 per tonne compared to fixed formulas, particularly when ingredient price relationships fluctuate. On a 5,000-head finishing operation, this translates to annual savings of $18,000-40,000 depending on market volatility and ingredient diversity.
Key Formulation Constraints
Effective formulation requires establishing appropriate constraints beyond basic nutrient requirements:
- Maximum inclusion limits prevent over-reliance on ingredients with anti-nutritional factors or palatability concerns
- Minimum inclusion limits ensure some presence of key ingredients for nutrient security
- Nutrient ratios maintain relationships like calcium-to-phosphorus (1.2:1 to 2:1) or lysine-to-threonine (100:65)
- Physical characteristics including bulk density, pelletability, and flowability
- Safety margins providing buffer above minimum requirements to account for ingredient variability
Essential Nutrients and Their Requirements
Understanding nutrient categories and their specific functions enables informed formulation decisions. The following table summarises the primary nutrient classes and their roles in pig production:
| Nutrient Category | Primary Functions | Deficiency Symptoms | Key Considerations |
|---|---|---|---|
| Energy (ME/NE) | Maintenance, growth, lactation, thermoregulation | Reduced growth, poor body condition, low milk production | Most expensive nutrient; pigs eat to satisfy energy needs |
| Amino Acids | Muscle protein synthesis, enzyme production, immune function | Poor growth, reduced lean gain, rough hair coat | Formulate a digestible basis; maintain ideal protein ratios |
| Calcium & Phosphorus | Bone formation, milk production, cellular function | Rickets, lameness, fractures, reduced litter size | Ca:P ratio critical; phosphorus availability varies by source |
| Trace Minerals | Enzyme cofactors, immune function, reproduction | Anemia, skin lesions, reproductive failure, immunity issues | Bioavailability differs between organic/inorganic sources |
| Vitamins | Metabolic cofactors, antioxidants, immune support | Specific deficiency syndromes; often subclinical losses | Stability during storage/processing; overage required |
| Fiber | Gut health, satiety, waste management | Minimal in growers; beneficial for sows (satiety and welfare) | Type matters: soluble vs insoluble; fermentability varies |
Energy Requirements by Production Stage
Energy drives feed intake—pigs consume feed primarily to meet their energy needs. The table below presents net energy (NE) requirements, which account for metabolic heat loss and provide more accurate formulation targets than metabolisable energy (ME):
| Production Stage | Body Weight (lbs) | Net Energy (kcal/kg diet) | Daily NE Intake (kcal) | ADG Target (lbs/day) |
|---|---|---|---|---|
| Nursery Phase 1 | 12-25 | 2,500-2,600 | 1,850-2,400 | 0.60-0.85 |
| Nursery Phase 2 | 25-50 | 2,450-2,500 | 2,900-3,800 | 0.95-1.15 |
| Grower | 50-120 | 2,350-2,400 | 4,200-6,400 | 1.60-1.85 |
| Early Finisher | 120-200 | 2,350-2,400 | 6,800-8,900 | 1.90-2.05 |
| Late Finisher | 200-280 | 2,350-2,400 | 9,200-10,500 | 1.85-1.95 |
| Gestation Sow | 350-450 | 2,100-2,200 | 6,300-7,200 | +0.80 (conceptus) |
| Lactation Sow | 350-450 | 2,500-2,600 | 14,500-16,800 | -0.50 to -1.50 (loss) |
Source: National Pork Board (2024), NRC Nutrient Requirements of Swine (2012, updated coefficients)
Amino Acid Requirements and Ideal Protein Ratios
Lysine serves as the reference amino acid in swine nutrition because it’s the first limiting amino acid in typical corn-soybean diets and is used almost exclusively for protein synthesis (minimal catabolism for energy).
All other essential amino acids are expressed as ratios to lysine in the ideal protein concept:
| Growth Stage | SID Lysine (%) | SID Thr:Lys | SID Met+Cys:Lys | SID Trp:Lys | SID Val:Lys |
|---|---|---|---|---|---|
| Nursery (15-25 lbs) | 1.35-1.45 | 65% | 58% | 19% | 68% |
| Nursery (25-50 lbs) | 1.25-1.35 | 65% | 60% | 18% | 68% |
| Grower (50-120 lbs) | 1.00-1.10 | 65% | 60% | 18% | 68% |
| Finisher (120-200 lbs) | 0.80-0.90 | 65% | 60% | 18% | 68% |
| Finisher (200-280 lbs) | 0.65-0.75 | 65% | 60% | 17% | 65% |
| Gestation | 0.50-0.55 | 67% | 62% | 18% | 70% |
| Lactation | 1.00-1.10 | 66% | 60% | 19% | 72% |
Source: Adapted from PIC Nutrition Guidelines (2024) and University of Minnesota Extension
Major and Trace Mineral Requirements
Mineral requirements vary by production stage, with particular attention needed for calcium and phosphorus due to their critical role in skeletal development and reproduction:
| Mineral | Nursery | Grower | Finisher | Gestation | Lactation | Primary Sources |
|---|---|---|---|---|---|---|
| Calcium (%) | 0.70-0.85 | 0.60-0.70 | 0.50-0.60 | 0.75-0.90 | 0.80-0.95 | Limestone, dicalcium phosphate |
| Total P (%) | 0.70-0.80 | 0.60-0.70 | 0.50-0.60 | 0.65-0.75 | 0.70-0.80 | Grain, dicalcium phosphate |
| Available P (%) | 0.55-0.65 | 0.45-0.55 | 0.38-0.48 | 0.45-0.55 | 0.50-0.60 | Inorganic phosphates, phytase |
| Sodium (%) | 0.15-0.20 | 0.12-0.16 | 0.10-0.15 | 0.12-0.16 | 0.18-0.22 | Salt (NaCl) |
| Zinc (ppm) | 100-120 | 80-100 | 80-100 | 80-100 | 100-120 | Zinc sulfate, zinc methionine |
| Iron (ppm) | 120-150 | 80-100 | 80-100 | 80-100 | 80-100 | Iron sulfate, injectable (piglets) |
| Copper (ppm) | 15-20 | 15-20 | 15-20 | 15-20 | 20-25 | Copper sulfate, copper proteinate |
| Selenium (ppm) | 0.30 | 0.30 | 0.30 | 0.30 | 0.30 | Sodium selenite, selenium yeast |
Note: Zinc at 2,000-3,000 ppm (pharmacological) may be used for 14 days post-weaning for enteric health (subject to regulatory limits)
Common Feed Ingredients and Nutritional Profiles
Understanding the nutritional characteristics and economic value of available ingredients is fundamental to effective formulation.
The following comprehensive table presents typical composition values for ingredients commonly used in U.S. swine diets:
| Ingredient | ME (kcal/kg) | NE (kcal/kg) | CP (%) | SID Lys (%) | Ca (%) | Avail P (%) | Typical Cost ($/ton) |
|---|---|---|---|---|---|---|---|
| Corn, yellow | 3,365 | 2,000 | 8.5 | 0.23 | 0.03 | 0.04 | $180-220 |
| Soybean meal, 48% | 2,230 | 1,650 | 48.0 | 2.93 | 0.27 | 0.18 | $360-440 |
| DDGS (corn) | 3,200 | 2,100 | 27.0 | 0.62 | 0.05 | 0.20 | $140-200 |
| Wheat | 3,420 | 2,050 | 13.0 | 0.31 | 0.05 | 0.09 | $190-240 |
| Wheat middlings | 2,850 | 1,750 | 17.0 | 0.54 | 0.12 | 0.24 | $120-180 |
| Bakery meal | 3,680 | 2,350 | 10.5 | 0.25 | 0.18 | 0.12 | $140-200 |
| Choice white grease | 8,350 | 3,200 | 0.0 | 0.00 | 0.00 | 0.00 | $800-1,100 |
| Soybean oil | 8,800 | 3,350 | 0.0 | 0.00 | 0.00 | 0.00 | $900-1,300 |
| Fish meal, menhaden | 2,920 | 2,100 | 61.0 | 4.68 | 5.10 | 1.85 | $1,600-2,200 |
| Whey, dried | 3,440 | 2,350 | 13.0 | 1.06 | 0.86 | 0.62 | $500-750 |
| Blood plasma, spray-dried | 3,200 | 2,250 | 78.0 | 6.85 | 0.20 | 1.05 | $2,800-3,800 |
| L-Lysine HCl | 0 | 0 | 0.0 | 78.40 | 0.00 | 0.00 | $2,400-3,200 |
| DL-Methionine | 0 | 0 | 0.0 | 0.00 | 0.00 | 0.00 | $3,800-5,200 |
| L-Threonine | 0 | 0 | 0.0 | 0.00 | 0.00 | 0.00 | $2,800-4,000 |
| Dicalcium phosphate | 0 | 0 | 0.0 | 0.00 | 23.00 | 17.50 | $520-680 |
| Limestone | 0 | 0 | 0.0 | 0.00 | 38.00 | 0.00 | $90-130 |
| Salt | 0 | 0 | 0.0 | 0.00 | 0.00 | 0.00 | $160-220 |
Sources: NRC (2012), Ingredient Matrix by Hans Stein (University of Illinois, 2024), USDA Agricultural Marketing Service (2024 price ranges)
Notes on Ingredient Selection:
- Energy density varies significantly — fats provide 2.5-3× the energy of grains per pound, justifying inclusion despite higher unit cost
- Amino acid balance differs — DDGS is relatively low in lysine (0.62% in 27% protein = 2.3% of protein as lysine) vs. soybean meal (2.93% in 48% protein = 6.1% of protein as lysine)
- Phosphorus bioavailability ranges from 14% in corn to 95% in dicalcium phosphate; phytase enzyme increases grain phosphorus availability to 45-60%
- Specialty ingredients (fish meal, plasma) provide high-quality protein and palatability enhancement but cost must be justified by performance improvements
- Synthetic amino acids contain zero energy but allow protein reduction while maintaining essential amino acid levels
The Pearson Square Method for Simple Formulation
The Pearson Square provides a rapid hand-calculation method for balancing two ingredients to achieve a target nutrient level.
While limited to two-ingredient problems, it’s valuable for quick estimates and teaching fundamental formulation principles.
Step-by-Step Pearson Square Example:
Problem: Formulate a diet containing 16% crude protein using corn (8.5% protein) and soybean meal (48% protein).
Solution:
- Draw a square and place the target nutrient level (16%) in the centre.
- Place the first ingredient’s nutrient level (corn, 8.5%) in the upper left corner
- Place the second ingredient’s nutrient level (soybean meal, 48%) in the lower left corner
- Subtract diagonally from centre to corners:
- Upper right = 48 – 16 = 32 parts corn
- Lower right = 16 – 8.5 = 7.5 parts soybean meal
- Sum the parts: 32 + 7.5 = 39.5 total parts
- Convert to percentages:
- Corn = 32 ÷ 39.5 = 81.0%
- Soybean meal = 7.5 ÷ 39.5 = 19.0%
 Corn (8.5%) -------- 32 parts
 \ /
 \ 16% /
 \ /
 \ /
 SBM (48%) -------- 7.5 parts
Verification: (81.0% × 8.5%) + (19.0% × 48%) = 6.89% + 9.12% = 16.01% ✓
Adding Additional Ingredients:
To create a complete diet, reserve space for salt, vitamin-mineral premix, and other additives:
- Corn: 81.0% × 99.0% = 80.2%
- Soybean meal: 19.0% × 99.0% = 18.8%
- Salt: 0.30%
- Vitamin-mineral premix: 0.50%
- Limestone: 0.20%
- Total: 100.0%
Limitations of Pearson Square:
- Balances only ONE nutrient at a time
- Cannot simultaneously optimize for protein AND energy
- Impractical with more than 2-3 ingredients
- Does not optimize for cost
- Ignores digestibility differences
For multi-nutrient, multi-ingredient formulations, algebraic simultaneous equations or linear programming software becomes necessary.
Advanced Least-Cost Formulation Techniques
Commercial operations use specialised software implementing linear programming algorithms to identify optimal ingredient combinations.
Popular programmes include Brill (Feed Formulation Excellence), Format International, Concept (Agri Concept), and Adifo Bestmix.
Linear Programming Formulation Process:
Step 1: Define the Objective Function
Minimize: Total Diet Cost = Σ (Ingredient Cost × Inclusion Level)
Example: Cost = ($0.10/lb × Corn%) + ($0.20/lb × SBM%) + ($0.40/lb × Fat%) + …
Step 2: Establish Nutrient Constraints
Subject to:
- Net Energy ≥ 2,350 kcal/kg
- SID Lysine ≥ 0.95%
- SID Threonine ≥ 0.62%
- Calcium ≥ 0.60% and ≤ 0.75%
- Available Phosphorus ≥ 0.45%
- Crude Protein ≤ 18% (environmental constraint)
- All vitamins and minerals ≥ requirements
Step 3: Set Ingredient Inclusion Bounds
- Corn: 50% minimum, 75% maximum
- Soybean meal: 10% minimum, 30% maximum
- DDGS: 0% minimum, 20% maximum
- Fat: 0% minimum, 4% maximum
- Synthetic lysine: 0% minimum, 0.50% maximum
- Limestone: 0.50% minimum, 1.50% maximum
- Dicalcium phosphate: 0% minimum, 1.50% maximum
- Salt: 0.25% minimum, 0.40% maximum
- Premix: 0.50% fixed
Step 4: Execute Optimization Algorithm
The software evaluates thousands of potential combinations, systematically testing ingredient ratios until identifying the global minimum cost solution meeting all constraints.
Example Optimisation Output for a 100-lb Grower Pig:
| Ingredient | Inclusion (%) | Cost Contribution ($/ton) |
|---|---|---|
| Corn | 71.24 | $142.48 |
| Soybean meal | 21.86 | $87.44 |
| DDGS | 0.00 | $0.00 |
| Choice white grease | 2.15 | $21.50 |
| L-Lysine HCl | 0.28 | $7.84 |
| DL-Methionine | 0.05 | $2.50 |
| L-Threonine | 0.07 | $2.52 |
| Dicalcium phosphate | 1.02 | $6.12 |
| Limestone | 0.98 | $1.18 |
| Salt | 0.30 | $0.60 |
| Vitamin-mineral premix | 0.50 | $13.00 |
| Phytase (1,000 FTU/kg) | 0.02 | $0.40 |
| Total | 100.00 | $285.58 |
Calculated Nutrient Profile:
| Nutrient | Formulated Level | Requirement | % Above Requirement |
|---|---|---|---|
| Net Energy (kcal/kg) | 2,368 | 2,350 | +0.8% |
| SID Lysine (%) | 0.96 | 0.95 | +1.1% |
| SID Threonine (%) | 0.63 | 0.62 | +1.6% |
| SID Met+Cys (%) | 0.58 | 0.57 | +1.8% |
| Calcium (%) | 0.65 | 0.60 | +8.3% |
| Available P (%) | 0.47 | 0.45 | +4.4% |
| Crude Protein (%) | 16.8 | — | Within limit |
Sensitivity Analysis:
The software can predict how formulation changes with ingredient price fluctuations:
| Price Change Scenario | Corn | SBM | DDGS | Diet Cost | Cost Change |
|---|---|---|---|---|---|
| Base (current prices) | 71.24% | 21.86% | 0.00% | $285.58 | — |
| Corn +10% ($220/ton) | 65.18% | 24.52% | 5.80% | $293.72 | +$8.14 |
| SBM +15% ($460/ton) | 73.86% | 19.24% | 2.40% | $298.45 | +$12.87 |
| DDGS -25% ($135/ton) | 59.42% | 18.68% | 17.40% | $279.86 | -$5.72 |
This analysis demonstrates that DDGS becomes economically attractive when priced at $135/tonne or below, replacing approximately 12% corn and 3% soybean meal.
Shadow Prices (Dual Values):
Shadow prices reveal the economic value of relaxing constraints:
- Maximum DDGS constraint (20%): Shadow price = $4.20/ton
- Increasing DDGS limit to 21% would save $4.20 per tonne.
- Minimum lysine requirement (0.95%): Shadow price = $312/unit
- Reducing lysine to 0.94% would save $3.12 per ton (not recommended for biological reasons)
- Maximum crude protein constraint (18%): Shadow price = $0.00
- Not currently limiting; relaxing has no economic benefit
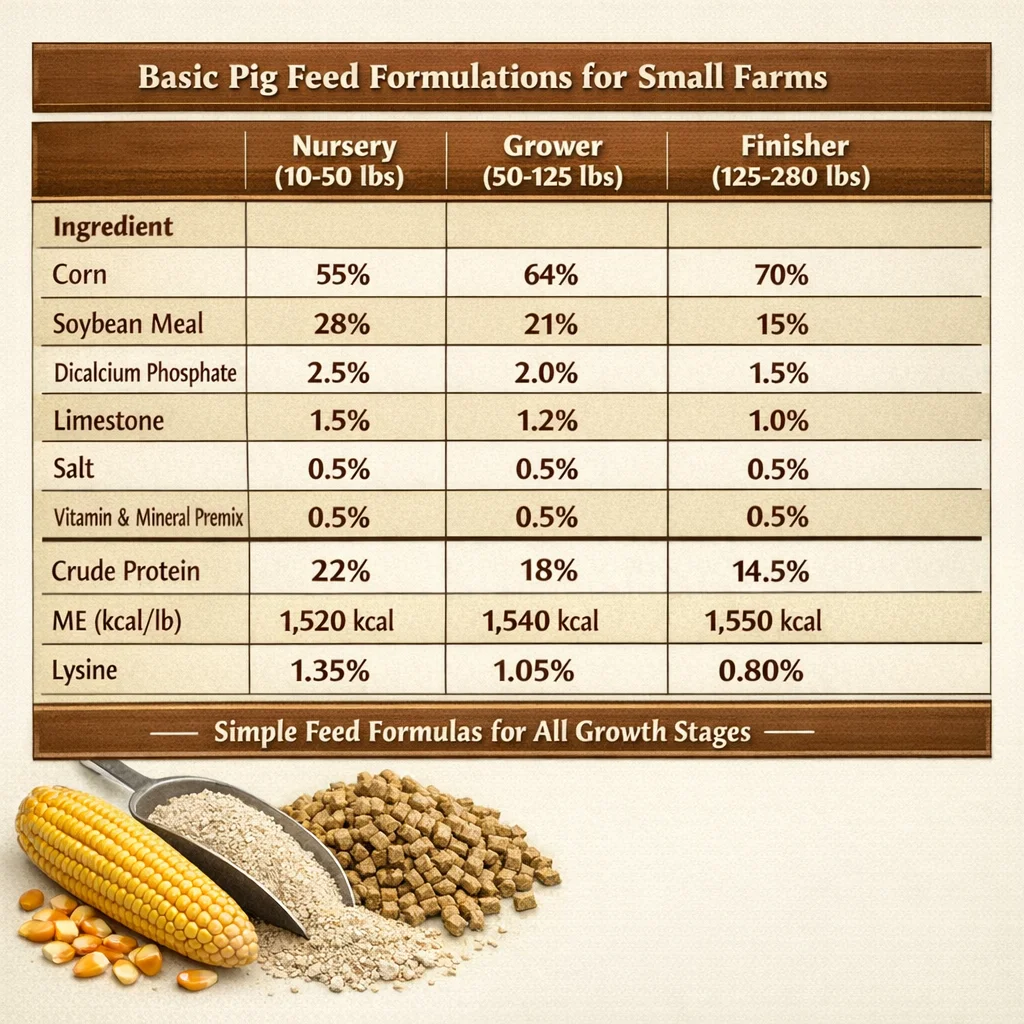
Stage-Specific Diet Formulations
The following table presents complete formulations for each major production stage, developed using least-cost optimisation with typical 2024 ingredient prices in the southeastern United States:
Complete Stage Formulation Matrix
| Ingredient (%) | Phase 1 Nursery (12-25 lbs) | Phase 2 Nursery (25-50 lbs) | Grower (50-120 lbs) | Early Finisher (120-200 lbs) | Late Finisher (200-280 lbs) | Gestation | Lactation |
|---|---|---|---|---|---|---|---|
| Corn | 47.85 | 61.24 | 71.24 | 75.68 | 79.85 | 58.42 | 64.28 |
| Soybean meal, 48% | 28.50 | 29.86 | 21.86 | 17.42 | 13.85 | 14.20 | 26.50 |
| DDGS | 0.00 | 0.00 | 0.00 | 0.00 | 0.00 | 12.00 | 0.00 |
| Wheat middlings | 0.00 | 0.00 | 0.00 | 0.00 | 0.00 | 8.50 | 0.00 |
| Fish meal, select menhaden | 7.00 | 2.50 | 0.00 | 0.00 | 0.00 | 0.00 | 0.00 |
| Whey, spray-dried | 4.50 | 0.00 | 0.00 | 0.00 | 0.00 | 0.00 | 0.00 |
| Plasma, spray-dried | 2.80 | 0.00 | 0.00 | 0.00 | 0.00 | 0.00 | 0.00 |
| Choice white grease | 4.20 | 2.85 | 2.15 | 1.80 | 1.20 | 0.80 | 4.25 |
| L-Lysine HCl | 0.38 | 0.35 | 0.28 | 0.24 | 0.18 | 0.08 | 0.22 |
| DL-Methionine | 0.18 | 0.12 | 0.05 | 0.04 | 0.03 | 0.02 | 0.08 |
| L-Threonine | 0.14 | 0.10 | 0.07 | 0.06 | 0.04 | 0.03 | 0.09 |
| L-Tryptophan | 0.02 | 0.01 | 0.00 | 0.00 | 0.00 | 0.00 | 0.01 |
| Dicalcium phosphate | 1.45 | 1.28 | 1.02 | 0.88 | 0.72 | 1.25 | 1.42 |
| Limestone | 0.92 | 0.98 | 0.98 | 0.92 | 0.88 | 1.18 | 1.08 |
| Salt | 0.28 | 0.30 | 0.30 | 0.30 | 0.30 | 0.35 | 0.40 |
| Vitamin-mineral premix | 0.50 | 0.50 | 0.50 | 0.50 | 0.50 | 0.50 | 0.50 |
| Phytase (1,000 FTU/kg) | 0.02 | 0.02 | 0.02 | 0.02 | 0.02 | 0.02 | 0.02 |
| Zinc oxide (pharmacological) | 1.26 | 0.00 | 0.00 | 0.00 | 0.00 | 0.00 | 0.00 |
| Total | 100.00 | 100.00 | 100.00 | 100.00 | 100.00 | 100.00 | 100.00 |
| Calculated Nutrient Profile: | |||||||
| Net Energy (kcal/kg) | 2,565 | 2,485 | 2,368 | 2,372 | 2,378 | 2,165 | 2,562 |
| Crude Protein (%) | 23.2 | 21.1 | 16.8 | 15.2 | 13.6 | 13.8 | 17.4 |
| SID Lysine (%) | 1.42 | 1.31 | 0.96 | 0.83 | 0.68 | 0.52 | 1.05 |
| SID Threonine (%) | 0.92 | 0.85 | 0.63 | 0.54 | 0.44 | 0.35 | 0.69 |
| SID Met+Cys (%) | 0.83 | 0.79 | 0.58 | 0.50 | 0.41 | 0.32 | 0.63 |
| SID Tryptophan (%) | 0.27 | 0.24 | 0.17 | 0.15 | 0.12 | 0.09 | 0.20 |
| Calcium (%) | 0.82 | 0.75 | 0.65 | 0.58 | 0.52 | 0.85 | 0.90 |
| Available Phosphorus (%) | 0.62 | 0.56 | 0.47 | 0.42 | 0.36 | 0.48 | 0.55 |
| Sodium (%) | 0.18 | 0.16 | 0.15 | 0.15 | 0.15 | 0.16 | 0.20 |
| Crude Fibre | 2.8 | 3.1 | 3.4 | 3.2 | 3.0 | 6.8 | 3.2 |
| Estimated Cost ($/ton) | $542 | $398 | $286 | $265 | $248 | $254 | $325 |
| Feed Cost/Pig (13 lbs) | $3.52 | ||||||
| Feed Cost/Pig (25 lbs) | $4.98 | ||||||
| Feed Cost/Pig (70 lbs) | $10.01 | ||||||
| Feed Cost/Pig (80 lbs) | $10.60 | ||||||
| Feed Cost/Pig (80 lbs) | $9.92 | ||||||
| Feed Cost/Sow/Day (5.5 lbs) | $0.70 | ||||||
| Feed Cost/Sow/Day (15 lbs) | $2.44 |
Notes on Stage-Specific Formulations:
- Phase 1 Nursery uses expensive speciality proteins (fish meal, whey, and plasma) to maximise palatability and digestibility during the critical post-weaning transition. High zinc oxide inclusion (2,500 ppm total zinc) controls enteric pathogens.
- Phase 2 Nursery eliminates plasma and reduces speciality proteins while maintaining high amino acid density to support rapid lean growth (1.0-1.2 lbs/day).
- Grower represents the transition to primarily corn-soybean meal diets supplemented with synthetic amino acids.
- This phase has the highest lean growth rate relative to body weight.
- Early and late finisher diets progressively reduce protein and amino acids as lean deposition slows and fat deposition accelerates. A late finisher represents the lowest-cost diet per tonne.
- Gestation includes moderate fibre (wheat middlings, DDGS) to improve satiety and gut health while controlling energy density to prevent obesity.
- Lactation maximises energy density with added fat to support milk production (15-18 lbs/day) while minimising sow weight loss.
Quality Control and Feed Testing
Rigorous quality control ensures formulated diets deliver intended nutrition. The following testing protocols are recommended based on operation size and risk tolerance:
Recommended Testing Schedule by Operation Size
| Test Type | Small Operations (<200 pigs) | Medium Operations (200-1,000 pigs) | Large Operations (>1,000 pigs) | Estimated Cost/Test |
|---|---|---|---|---|
| Moisture | As-needed | Monthly | Every delivery | $5-10 (on-farm meter) |
| Crude Protein | Semi-annually | Quarterly | Monthly | $15-25 |
| Amino Acids (Lys, Met, Thr) | Annually | Semi-annually | Quarterly | $75-120 |
| Energy (calculated from proximate analysis) | Annually | Semi-annually | Quarterly | Included in CP/Fat analysis |
| Calcium & Phosphorus | Annually | Semi-annually | Quarterly | $25-40 |
| Trace Minerals Panel | As-needed | Annually | Semi-annually | $85-140 |
| Vitamin Analysis (A, E) | As-needed | Annually | Annually | $95-150 |
| Mycotoxin Screen | As-needed (risk conditions) | Quarterly (grains) | Monthly (grains) | $45-85 (ELISA) |
| Particle Size | N/A | Semi-annually | Quarterly | $0 (sieve shaker) |
| Pellet Durability Index | N/A | As-needed | Monthly (pelleted feeds) | $0 (tumbler) |
| Salmonella | N/A | Annually | Quarterly | $45-75 |
Sample Collection Protocol:
Proper sampling technique is critical for accurate results. Follow this procedure:
- Frequency: Collect samples from 8-12 random locations within the batch
- Depth: Sample from top, middle, and bottom of bins or bags
- Equipment: Use clean grain probe or cup, avoiding contamination
- Quantity: Collect 2-3 pounds total; mix thoroughly; submit 1 pound to lab
- Storage: Place in clean, labeled plastic bag or container
- Timing: Submit within 48 hours; refrigerate if delay exceeds 24 hours
Interpreting Lab Results:
Results should fall within acceptable tolerances of formulated values:
| Nutrient | Acceptable Variance from Formulated | Action if Outside Range |
|---|---|---|
| Moisture | ±1.0 percentage points | Reject if >14%; adjust future formulations |
| Crude Protein | ±0.5 percentage points | Investigate mixing accuracy or ingredient quality |
| Lysine | ±0.08 percentage points | Check heat damage (pelleting temp.); verify ingredient sources |
| Calcium | ±0.10 percentage points | Verify limestone/DCP inclusion and check mixer uniformity |
| Phosphorus | ±0.08 percentage points | Verify DCP inclusion; confirm phytase activity |
| Salt | ±0.05 percentage points | Check scale calibration and verify batch sheets |
In my operation, we maintain a quality control database tracking all test results over time. Trending analysis reveals patterns—for example, we discovered lysine degradation averaging 8% during summer pelleting (barn temperature 92-98°F) compared to 3% in winter, leading to increased vitamin/amino acid overages in summer formulations.
Practical Formulation Example
Let’s work through a complete formulation from start to finish for a 100-pound grower pig.
Step 1: Define Production Goals and Requirements
- Target: 100-pound grower pig
- Growth rate goal: 1.80 lbs/day
- Feed intake expected: 5.0 lbs/day
- Net energy requirement: 2,360 kcal NE/kg
- SID Lysine requirement: 0.96%
- SID Threonine: 0.63% (65% of lysine)
- SID Met+Cys: 0.58% (60% of lysine)
- Calcium: 0.62%
- Available phosphorus: 0.46%
Step 2: Survey Available Ingredients and Prices (January 2025, North Carolina)
| Ingredient | Price ($/ton) | Price ($/lb) |
|---|---|---|
| Corn | $198 | $0.099 |
| Soybean meal, 48% | $408 | $0.204 |
| DDGS | $172 | $0.086 |
| Choice white grease | $920 | $0.460 |
| L-Lysine HCl (78%) | $2,720 | $1.360 |
| DL-Methionine (99%) | $4,200 | $2.100 |
| L-Threonine (98.5%) | $3,400 | $1,700 |
| Dicalcium phosphate | $600 | $0.300 |
| Limestone | $115 | $0.058 |
| Salt | $185 | $0.093 |
| Premix (custom) | $2,600 | $1.300 |
| Phytase (10,000 FTU/g) | $22/kg | — |
Step 3: Set Formulation Constraints
Ingredient Bounds:
- Corn: 60-75%
- Soybean meal: 15-28%
- DDGS: 0-15%
- Fat: 1-3%
- Lysine: 0-0.40%
- Threonine: 0-0.12%
- Methionine: 0-0.08%
- DCP: 0.50-1.50%
- Limestone: 0.70-1.30%
- Salt: 0.25-0.35%
- Premix: 0.50% (fixed)
- Phytase: 0.02% (fixed, provides 1,000 FTU/kg)
Step 4: Run Least-Cost Optimization
Using formulation software with the above inputs produces:
| Ingredient | Inclusion (%) | Cost/Ton Contribution |
|---|---|---|
| Corn | 71.85 | $142.27 |
| Soybean meal | 19.64 | $80.13 |
| DDGS | 2.48 | $4.26 |
| Choice white grease | 2.00 | $18.40 |
| L-Lysine HCl | 0.31 | $8.43 |
| DL-Methionine | 0.04 | $1.68 |
| L-Threonine | 0.08 | $2.72 |
| Dicalcium phosphate | 1.05 | $6.30 |
| Limestone | 0.96 | $1.11 |
| Salt | 0.30 | $0.56 |
| Premix | 0.50 | $13.00 |
| Phytase | 0.02 | $0.44 |
| Total | 100.00% | $279.30/ton |
Step 5: Verify Nutrient Profile
| Nutrient | Calculated | Required | Met? |
|---|---|---|---|
| Net Energy (kcal/kg) | 2,371 | 2,360 | ✓ Yes (+0.5%) |
| SID Lysine (%) | 0.97 | 0.96 | ✓ Yes (+1.0%) |
| SID Threonine (%) | 0.63 | 0.63 | ✓ Yes (exact) |
| SID Met+Cys (%) | 0.58 | 0.58 | ✓ Yes (exact) |
| Calcium (%) | 0.64 | 0.62 | ✓ Yes (+3.2%) |
| Available P (%) | 0.47 | 0.46 | ✓ Yes (+2.2%) |
| Crude Protein (%) | 16.4 | — | — |
Step 6: Economic Analysis
Cost per pig (weaning at 50 lbs to 120 lbs finish):
- Feed consumed: 70 lbs × (50 to 120 lb phase)
- Feed cost: 70 lbs ÷ 2,000 lbs/tonnene × $279.30/tonnene = $9.78 per pig
Feed conversion ratio: 70 lbs feed ÷ 70 lbs gain = 1:1 (theoretical) Actual FCR expected with this formulation: 2.68:1 Actual feed consumed: 70 lbs gain × 2.68 FCR = 187.6 lbs. Actual feed cost: 187.6 lbs ÷ 2,000 × $279.30 = $26.21 per pig (50-120 lbs)
Step 7: Sensitivity Testing
What if corn prices increase 15% to $228/tonne?
Re-optimised formulation:
| Ingredient | Original (%) | (+15% Corn) | Change |
|---|---|---|---|
| Corn | 71.85 | 66.42 | -5.43% |
| Soybean meal | 19.64 | 20.18 | +0.54% |
| DDGS | 2.48 | 8.95 | +6.47% |
| All others | 6.03 | 4.45 | -1.58% |
| Diet Cost | $279.30 | $288.65 | +$9.35 |
a fixedThe software automatically substitutes cheaper DDGS (now more economically attractive relative to corn) to minimize cost impact, limiting increase to $9.35/ton rather than the $17.10/tonnene that would occur with $17.10/tonnenefixed formulation.
Pro Tip from James Cooper
judgementThe most valuable feed formulation skill isn’t mastering complex software or linear programming mathematics—it’s developing a fixedjudgment around ingredient variability and building testing protocols that catch problems before they impact pig performance.
Feed ingredient composition tables—whether from NRC, university databases, or supplier specifications—list “typical” or “average” values. Corn averages 8.5% protein. Soybean meal averages 47-48% protein. DDGS averages 27% protein. But in the real world, I’ve seen corn protein range from 7.1% to 9.4%, soybean meal from 44.2% to 49.1%, and DDGS from 24.8% to 31.2% across different deliveries to my North Carolina farm in 2024.
If you formulate assuming average values but receive low-quality ingredients, your pigs become deficient in critical amino acids despite the formula looking perfect on paper. If you receive high-quality ingredients but formulate conservatively, you’re over-feeding expensive protein and wasting money.
My Three-Tier Testing Protocol:
Tier 1 — Every Delivery (Major Ingredients):
- Moisture test with handheld meter ($220 investment, <2 minutes)
- Visual inspection for color, odor, foreign material
- Reject immediately if moisture >14% or quality concerns evident
Tier 2 — Monthly (Composite Samples):
- NIR analysis ($28,000 equipment investment in 2021, but now testing costs <$1/sample)
- Tests protein, fat, fiber, moisture, ash in 90 seconds
- Update ingredient matrix in formulation software when values shift >5% from assumed
Tier 3 — Quarterly (Finished Feed Validation):
- Wet chemistry analysis for crude protein, amino acids, minerals
- Costs $180 per complete analysis
- Verifies that formulation, ingredient quality, and mixing accuracy all align
In 2023, this three-tier system caught eight significant problems before they impacted performance:
- Three corn loads at 7.2-7.4% protein (we’d formulated assuming 8.5% judgementwould have created lysine deficiency costing estimated $0.08/lb gain
- One DDGS load at 24.1% protein, 6.8% fat (assumed 27% and 9%) — reformulated immediately, avoiding performance loss
- Two soybean meal deliveries showing elevated urease activity (inadequate heat treatment) — rejected before feeding
- One finished feed batch testing 15.1% protein instead of formulated 16.8% — traced to scale calibration error at feed mill
- One mineral premix batch testing only 62% of labeled vitamin A potency (storage degradation) — supplier credited and replaced it.replaced it.
Total testing investment 2023: $8,420 Total performance losses avoided (estimated): $31,500 Net value: $23,080 return on $8,420 investment = 274% ROI
The farmers who struggle financially with feed costs aren’t necessarily formulating poorly—they’re often feeding something different than what they think they formulated due to ingredient variability, mixing errors, or quality deterioration. Test, verify, adjust. The investment is minimal compared to the protection it provides.
FAQ
What’s the difference between metabolisablemetabolisable energy (ME) and net energy (NE) in feed formulation?
Metabolisable energy represents total digestible energy minus energy lost in urine and gases. Net energy further subtracts energy lost as heat during digestion and metabolism (heat increment), representing only energy actually available for maintenance, growth, and reproduction.
NE provides a more accurate formulation because the heat increment varies significantly by ingredient—fibre produces high heat loss (60-65% of ME is lost), while fat is very efficient (only 10-15% loss).
Modern formulation uses NE because it better predicts pig performance, particularly when using diverse ingredients with different fibre levels.
Research from Iowa State University (2024) showed NE-based formulation improved feed conversion by 2-3% compared to ME formulation when diets included 15%+ co-products.
How do I calculate the cost per unit of energy or protein from different ingredients?
Calculate cost per nutrient unit to compare ingredient value. For energy: (Price per tonne ÷ 2,000 lbs) ÷ (Energy per lb ÷ 1,000) = Cost per Mcal. Example: Corn at $200/tonne with 1,530 kcal ME/lb = ($200 ÷ 2,000) ÷ (1.53) = $0.065 per Mcal ME.
For protein: (Price per tonne ÷ 2,000 lbs) ÷ (Protein fraction) = Cost per lb of protein. Example: Soybean meal at $400/tonne with 48% protein = ($400 ÷ 2,000) ÷ 0.48 = $0.417 per lb of protein. Compare multiple ingredients—the lowest cost per nutrient usually merits higher inclusion, subject to quality and palatability constraints.
Can I use Excel spreadsheets instead of expensive formulation software?
Yes, Excel can perform least-cost formulation using the Solver add-in (which is free with Excel). Set up columns for each ingredient with composition and price, rows for each nutrient requirement, and cells calculating nutrient contribution from each ingredient at various inclusion levels, and use Solver to minimise total cost while meeting all nutrient constraints.
This works well for operations with limited ingredient options (5-10 ingredients). However, commercial software offers significant advantages: larger ingredient libraries (100+ ingredients), saved formulations for quick reformulation, batch management, label printing, and regulatory compliance features.
For operations feeding >500 pigs or using >12 ingredients, commercial software ($2,000-5,000 annually) typically pays for itself within 6-12 months through improved formulation precision.
How often should I reformulate diets based on changing ingredient prices?
Commercial operations should reformulate weekly when ingredient prices fluctuate, which is standard during volatile markets.
Set up supplier quotes delivered every Monday, reformulate Monday afternoon, and order ingredients Tuesday for Wednesday delivery. This captures cost savings from ingredient price relationships.
During stable markets (prices changing <3% weekly), monthly reformulation suffices. However, always reformulate immediately when a major ingredient price changes >10% or when introducing new ingredient sources.
Some large operations reformulate daily using automated systems tied to commodity markets. On my farm, weekly reformulation during 2024’s volatile grain markets saved an average $4.20/tonne ($18,500 annually) compared to monthly reformulation.
What’s the minimum number of ingredients needed for a complete pig diet?
Theoretically, 5 ingredients can create nutritionally complete diets:
(1) energy source (corn/grain),
(2) protein source (soybean meal),
(3) calcium source (limestone),
(4) phosphorus source (dicalcium phosphate), and
(5) vitamin-mineral premix (including salt).
Practical minimum: 8-10 ingredients improve formulation flexibility and reduce risk: add synthetic amino acids (lysine, threonine, and methionine) to reduce protein cost, add fat for energy density, and include phytase for phosphorus efficiency.
Optimal range: 12-18 ingredients provides maximum formulation flexibility and cost optimisation while maintaining manageable inventory and quality control.
Operations using 25+ ingredients usually include many speciality items for specific phases (fish meal, whey, and plasma in the nursery) or opportunistic purchases (bakery meal and distillers grains when priced favourably).
How do I account for the phytase enzyme when formulating diets?
Phytase liberates phosphorus from phytate in grains, increasing availability from 15% to 45-65% depending on dose. Standard inclusion: 500-1,000 FTU (phytase units) per kg of feed. Matrix values (nutrient credits) at 1,000 FTU/kg: 0.12-0.15% available phosphorus, 0.10-0.12% calcium (released when phytate binds less calcium), 50-85 kcal ME/kg (from reduced endogenous losses).
In formulation software, create a “phytase” ingredient with these matrix values at your target inclusion level (typically 0.01-0.02% to provide 1,000 FTU/kg).
The software automatically credits phosphorus/calcium, allowing reduced dicalcium phosphate inclusion.
On my farm, phytase saves $2.80-4.20/tonne in grower-finisher diets by reducing dicalcium phosphate from 1.45% to 0.95-1.05% while maintaining bone strength and growth performance.
Conclusion
Feed formulation combines nutritional science, ingredient knowledge, and economic optimisation to create diets that maximise pig performance at minimum cost.
The fundamental principles—meeting all nutrient requirements simultaneously through least-cost ingredient combinations—remain constant, but successful application requires attention to ingredient variability, digestibility, and practical feeding constraints.
Modern formulation tools, particularly least-cost linear programming software, enable rapid optimisation across dozens of nutrients and ingredients, automatically adjusting formulations as prices fluctuate.
However, technology cannot substitute for fundamental understanding of nutrient requirements, ingredient characteristics, and quality control protocols that ensure formulated diets actually deliver intended nutrition.
The three keys to formulation success are:
(1) accurate nutrient requirement targets based on current genetics and production conditions, (2) reliable ingredient composition data verified through regular testing, and
(3) rigorous quality control confirming finished feeds match formulated specifications. Operations implementing these three elements consistently outperform competitors by 5-8% in feed conversion efficiency and $6-12 per pig in profitability.
For comprehensive integration of formulation principles with overall pig nutrition management and understanding how balanced protein, energy, and fibre, along with essential vitamins and minerals, work together in complete feeding programmes, these complementary resources provide the complete nutritional framework for successful pig production.

